Every feature ccgauge ships, in one page.
Ten feature areas, all built around the same two ideas: keep your data on your machine, and answer the "where is my AI spend going" question in seconds.
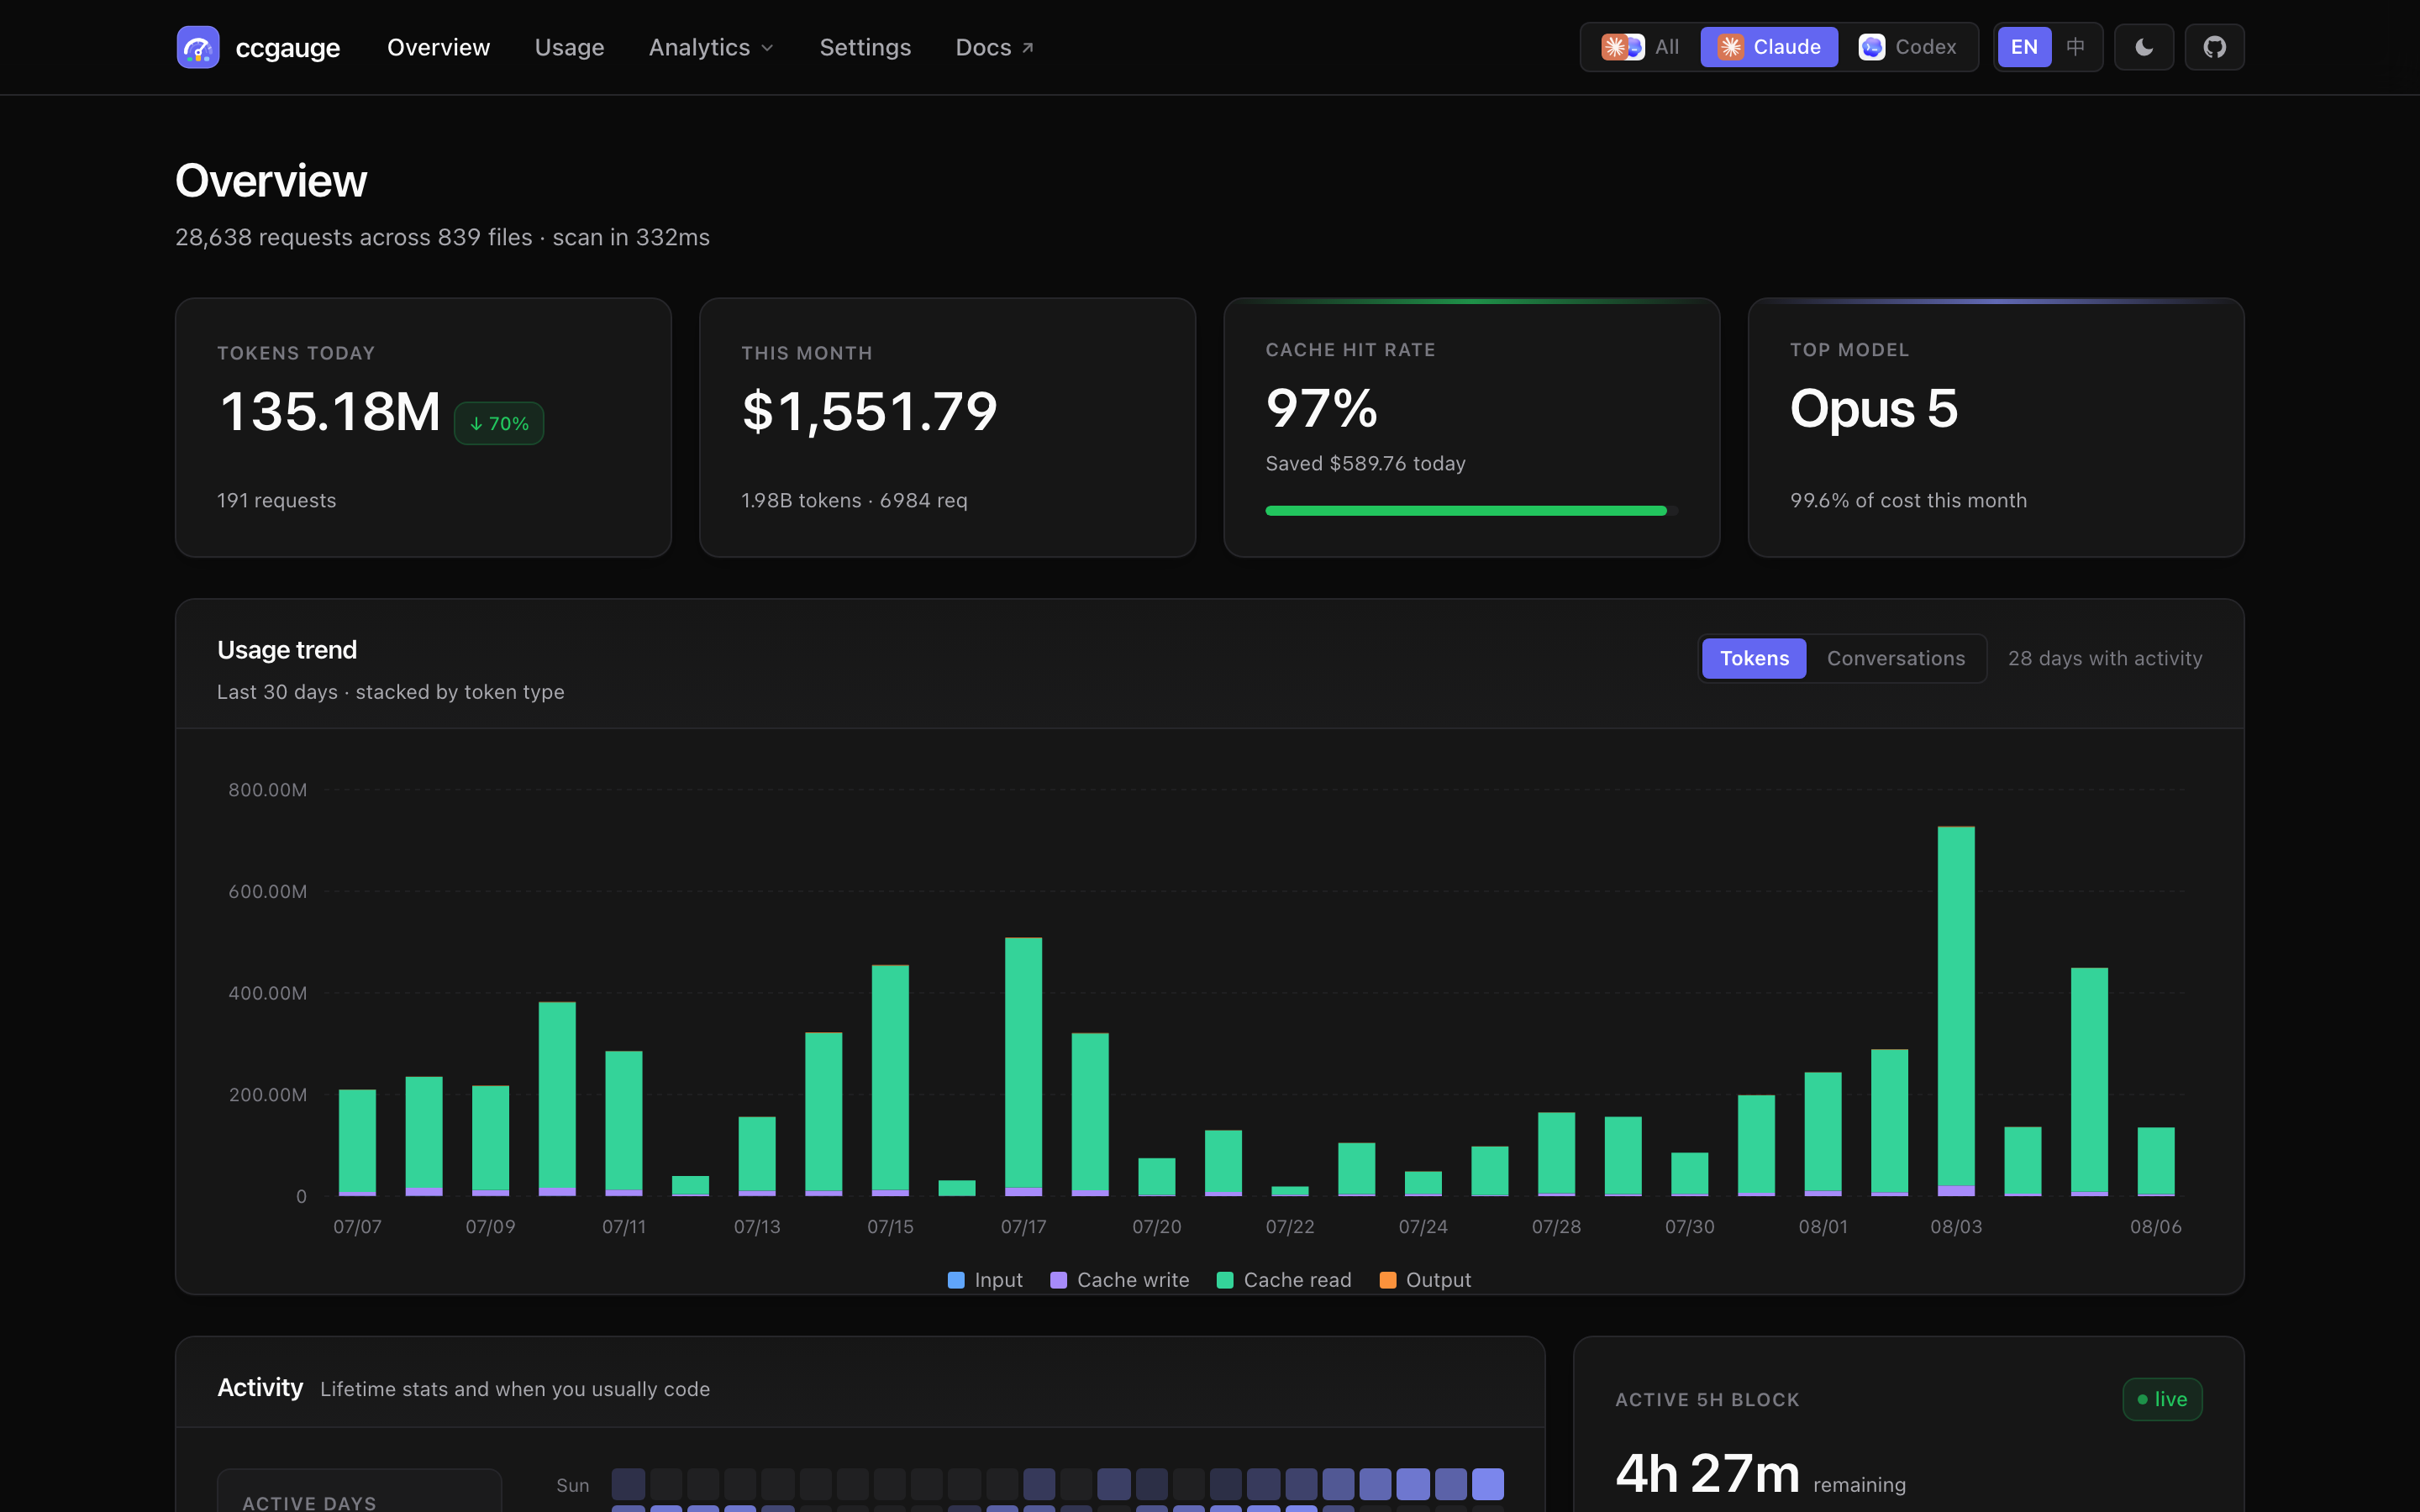
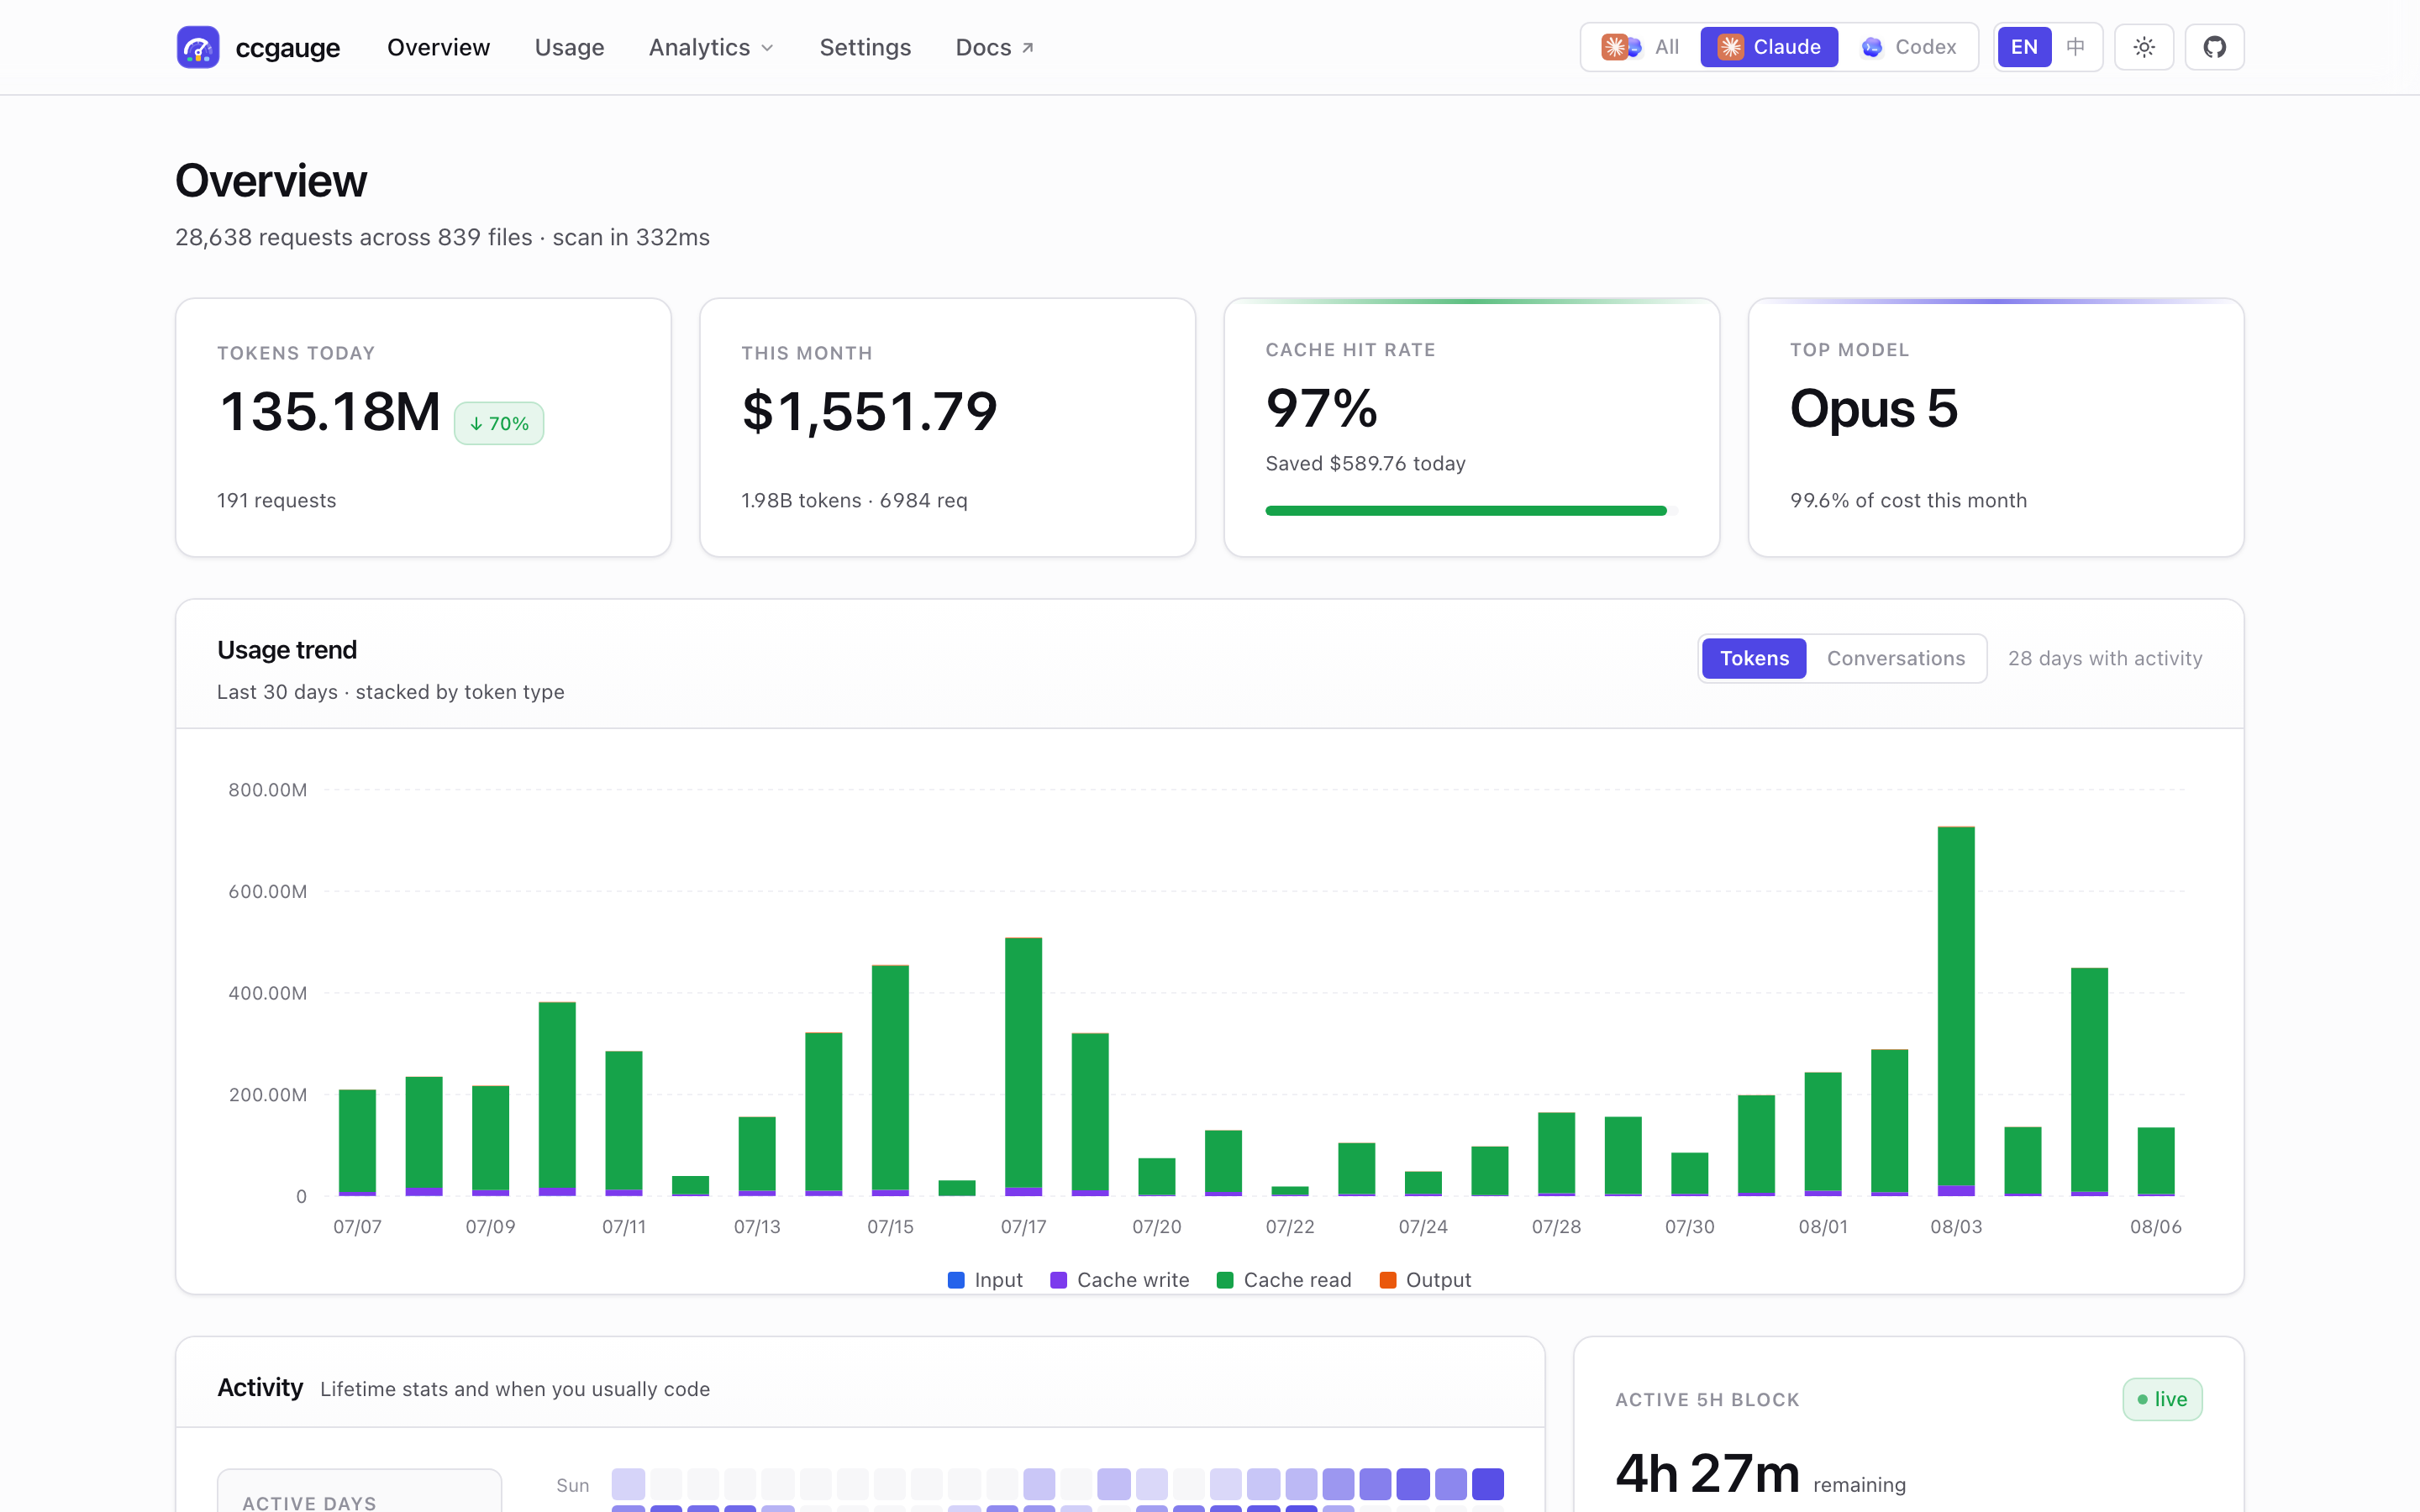
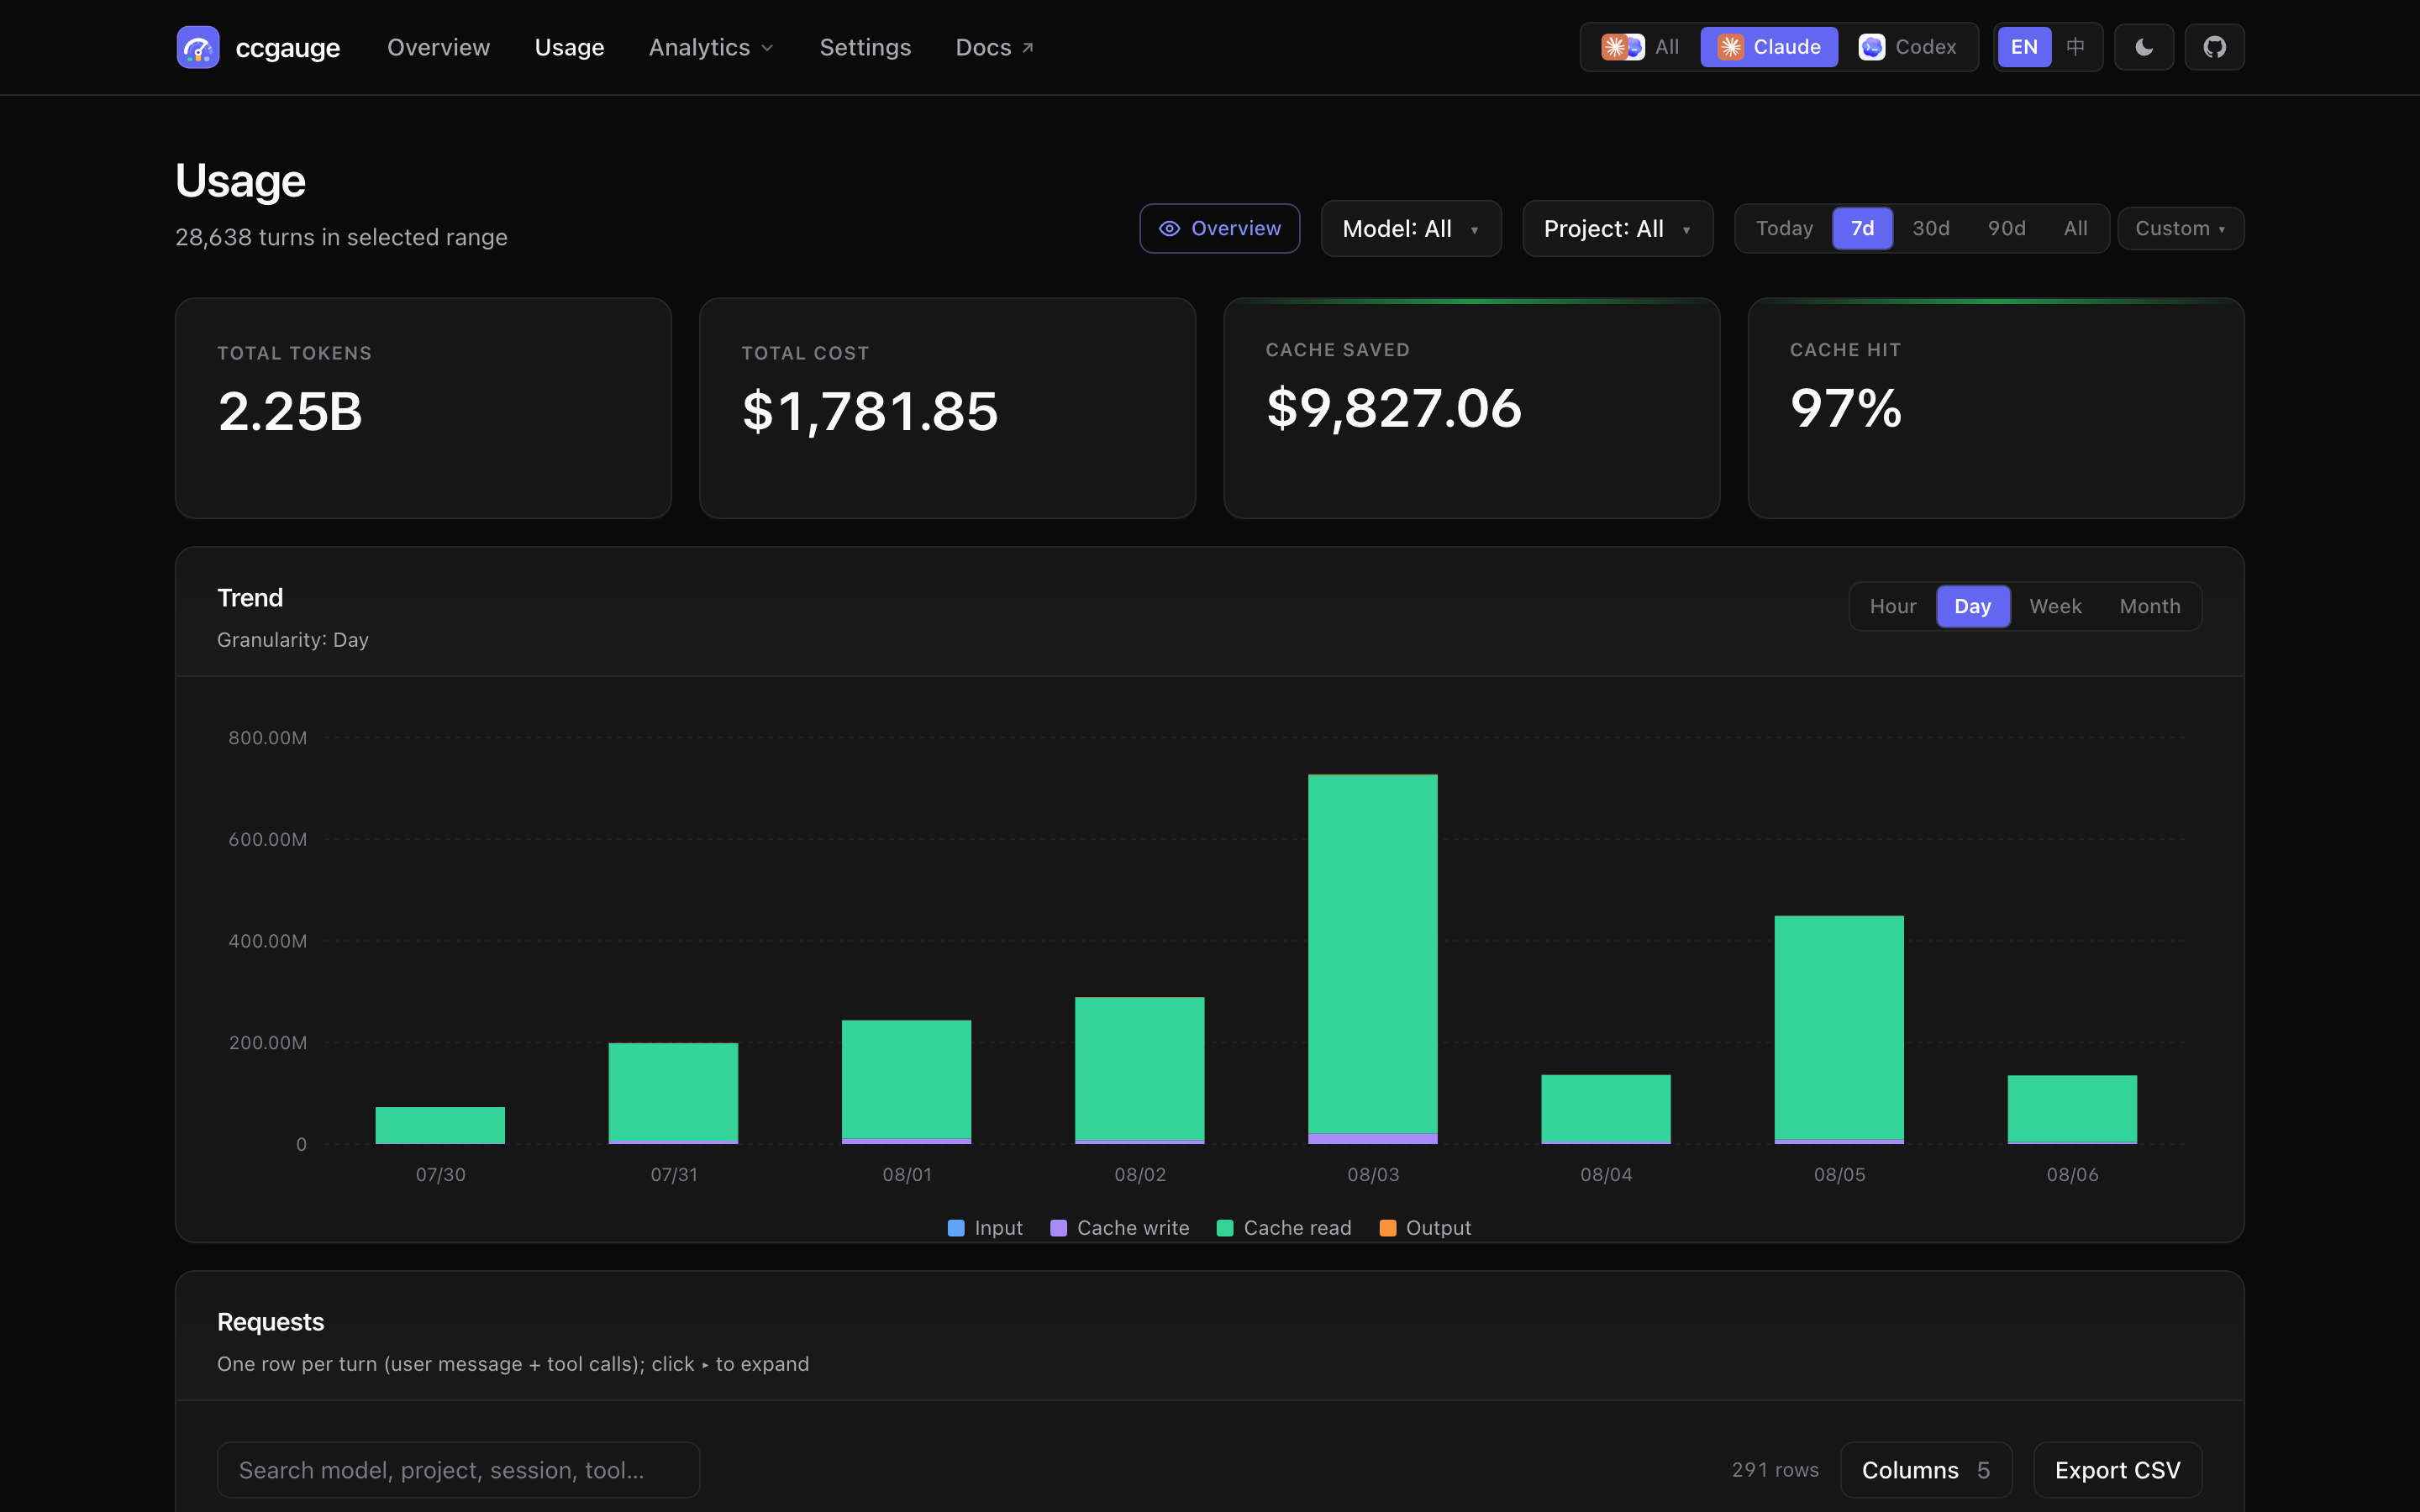
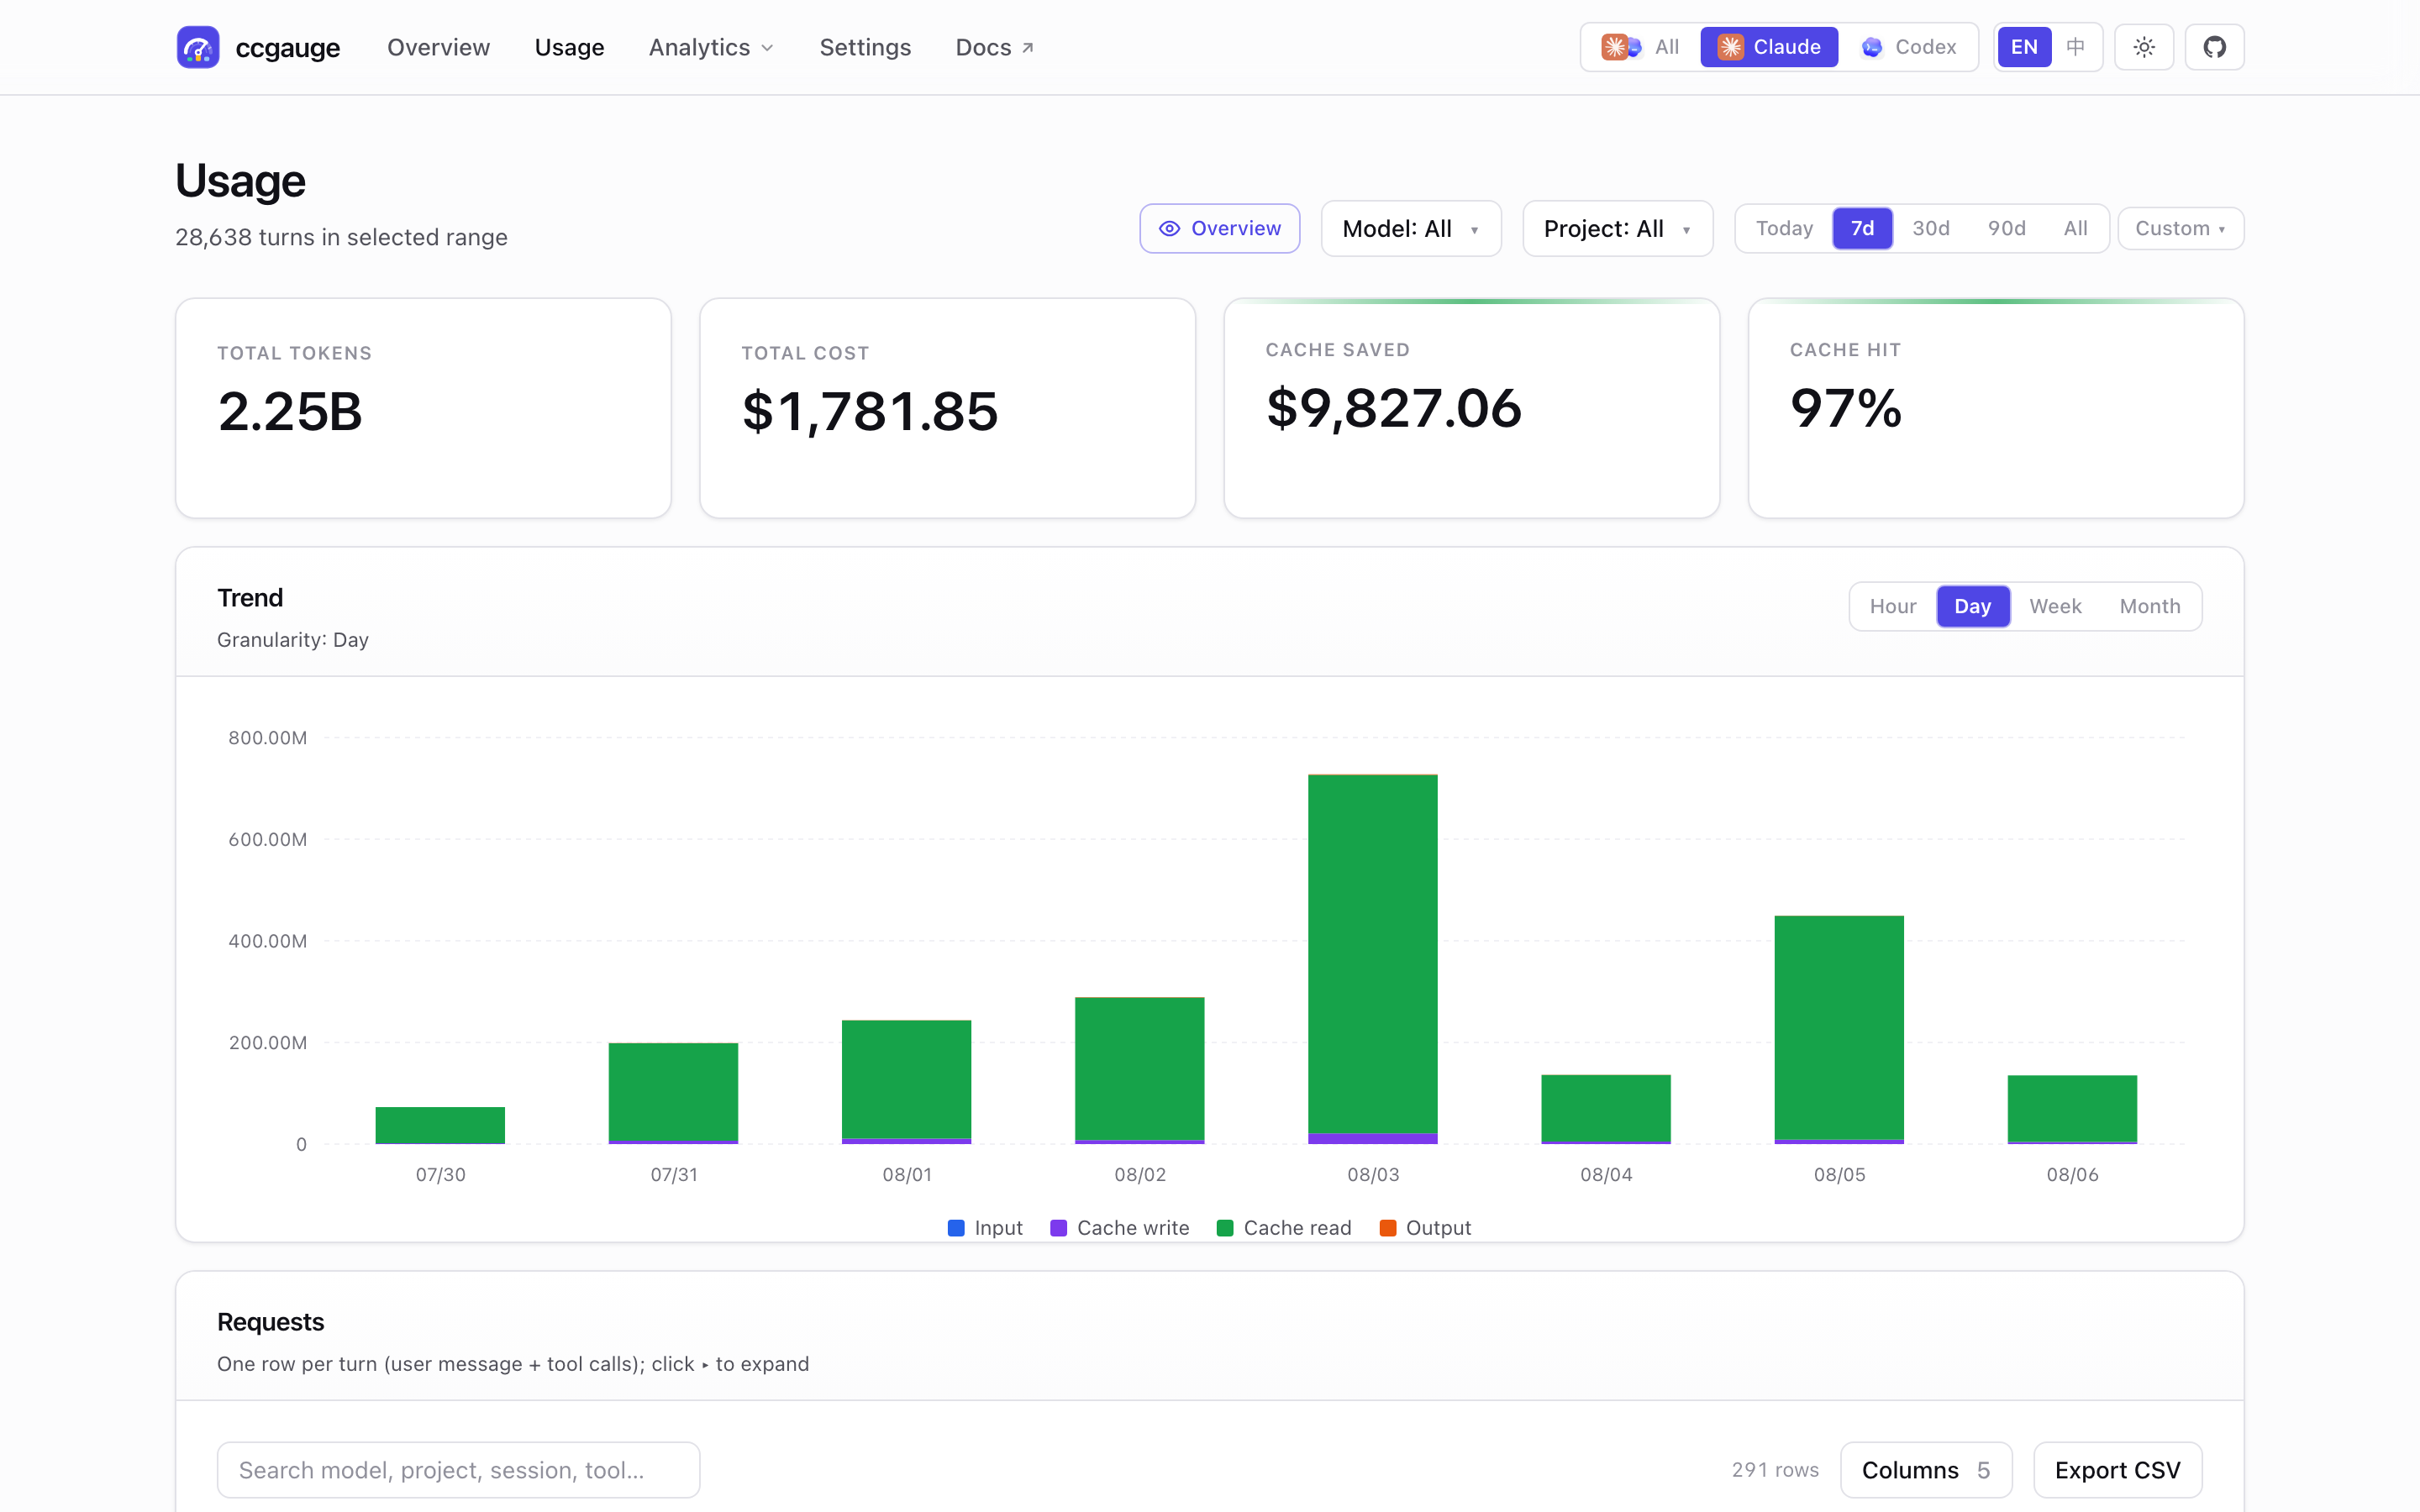
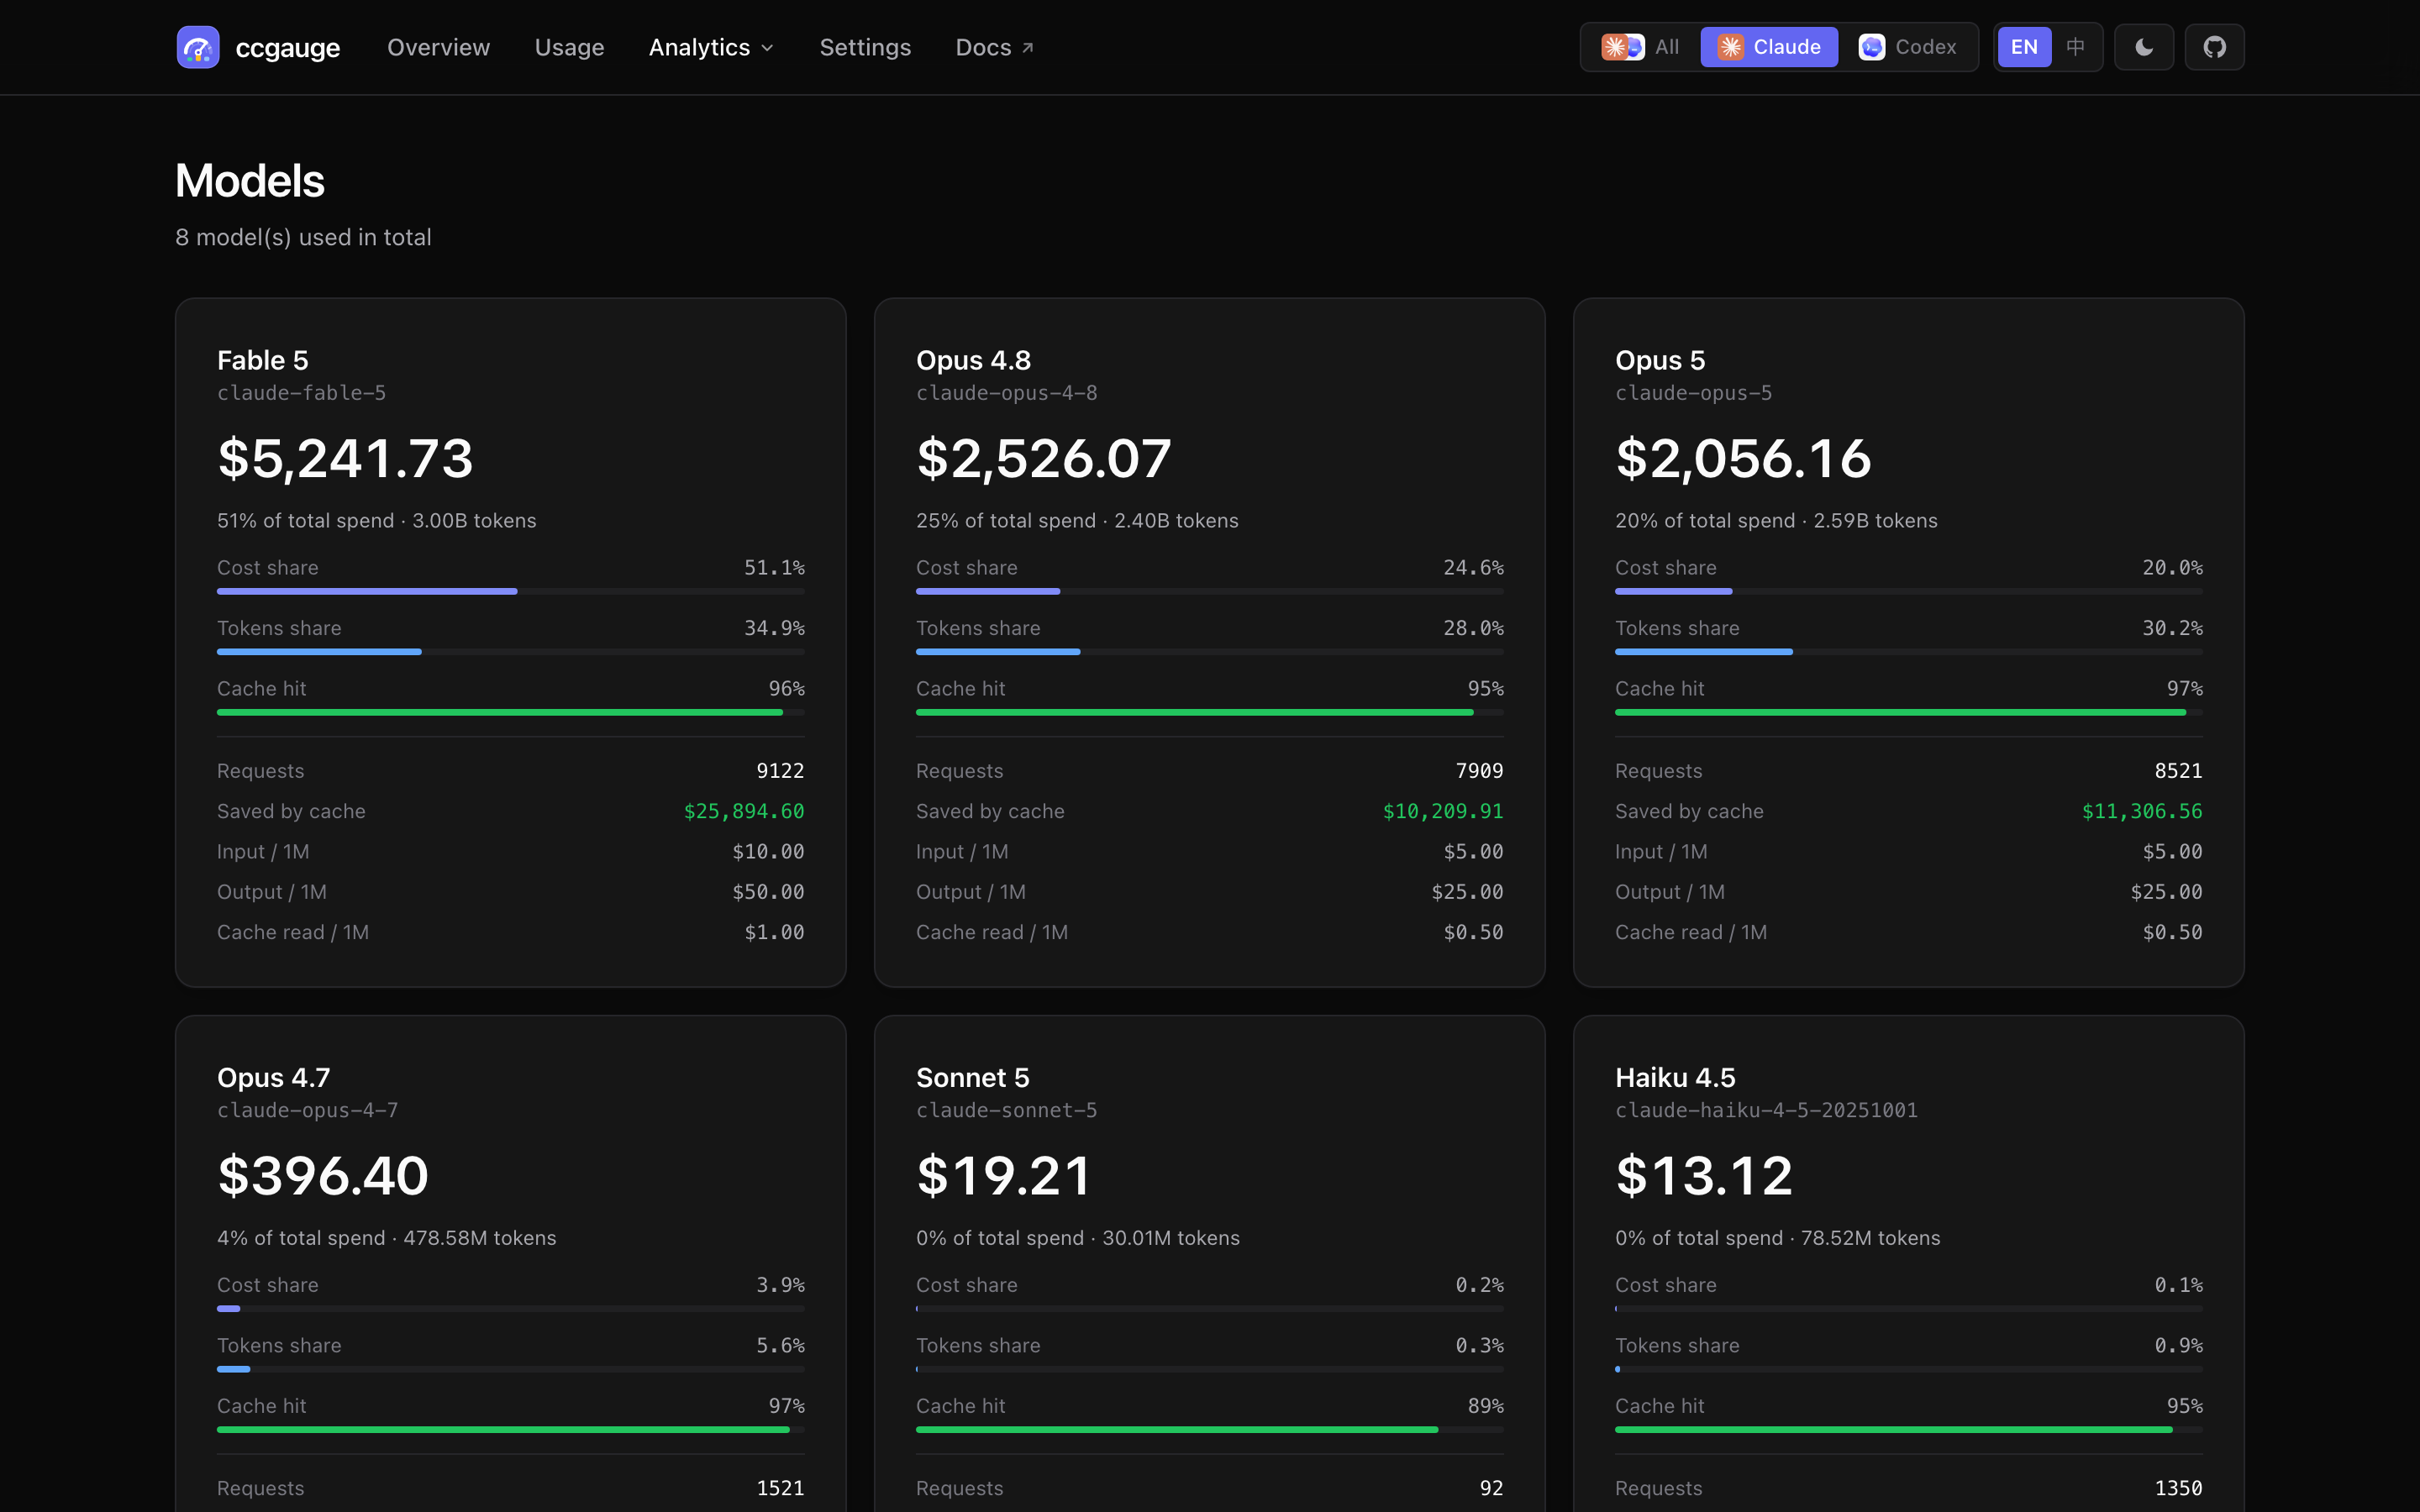
The docs now show the real running dashboard.
These captures come from the local ccgauge app running on this machine, so the feature tour reflects the actual product surfaces instead of placeholder art.
Multi-source web dashboard
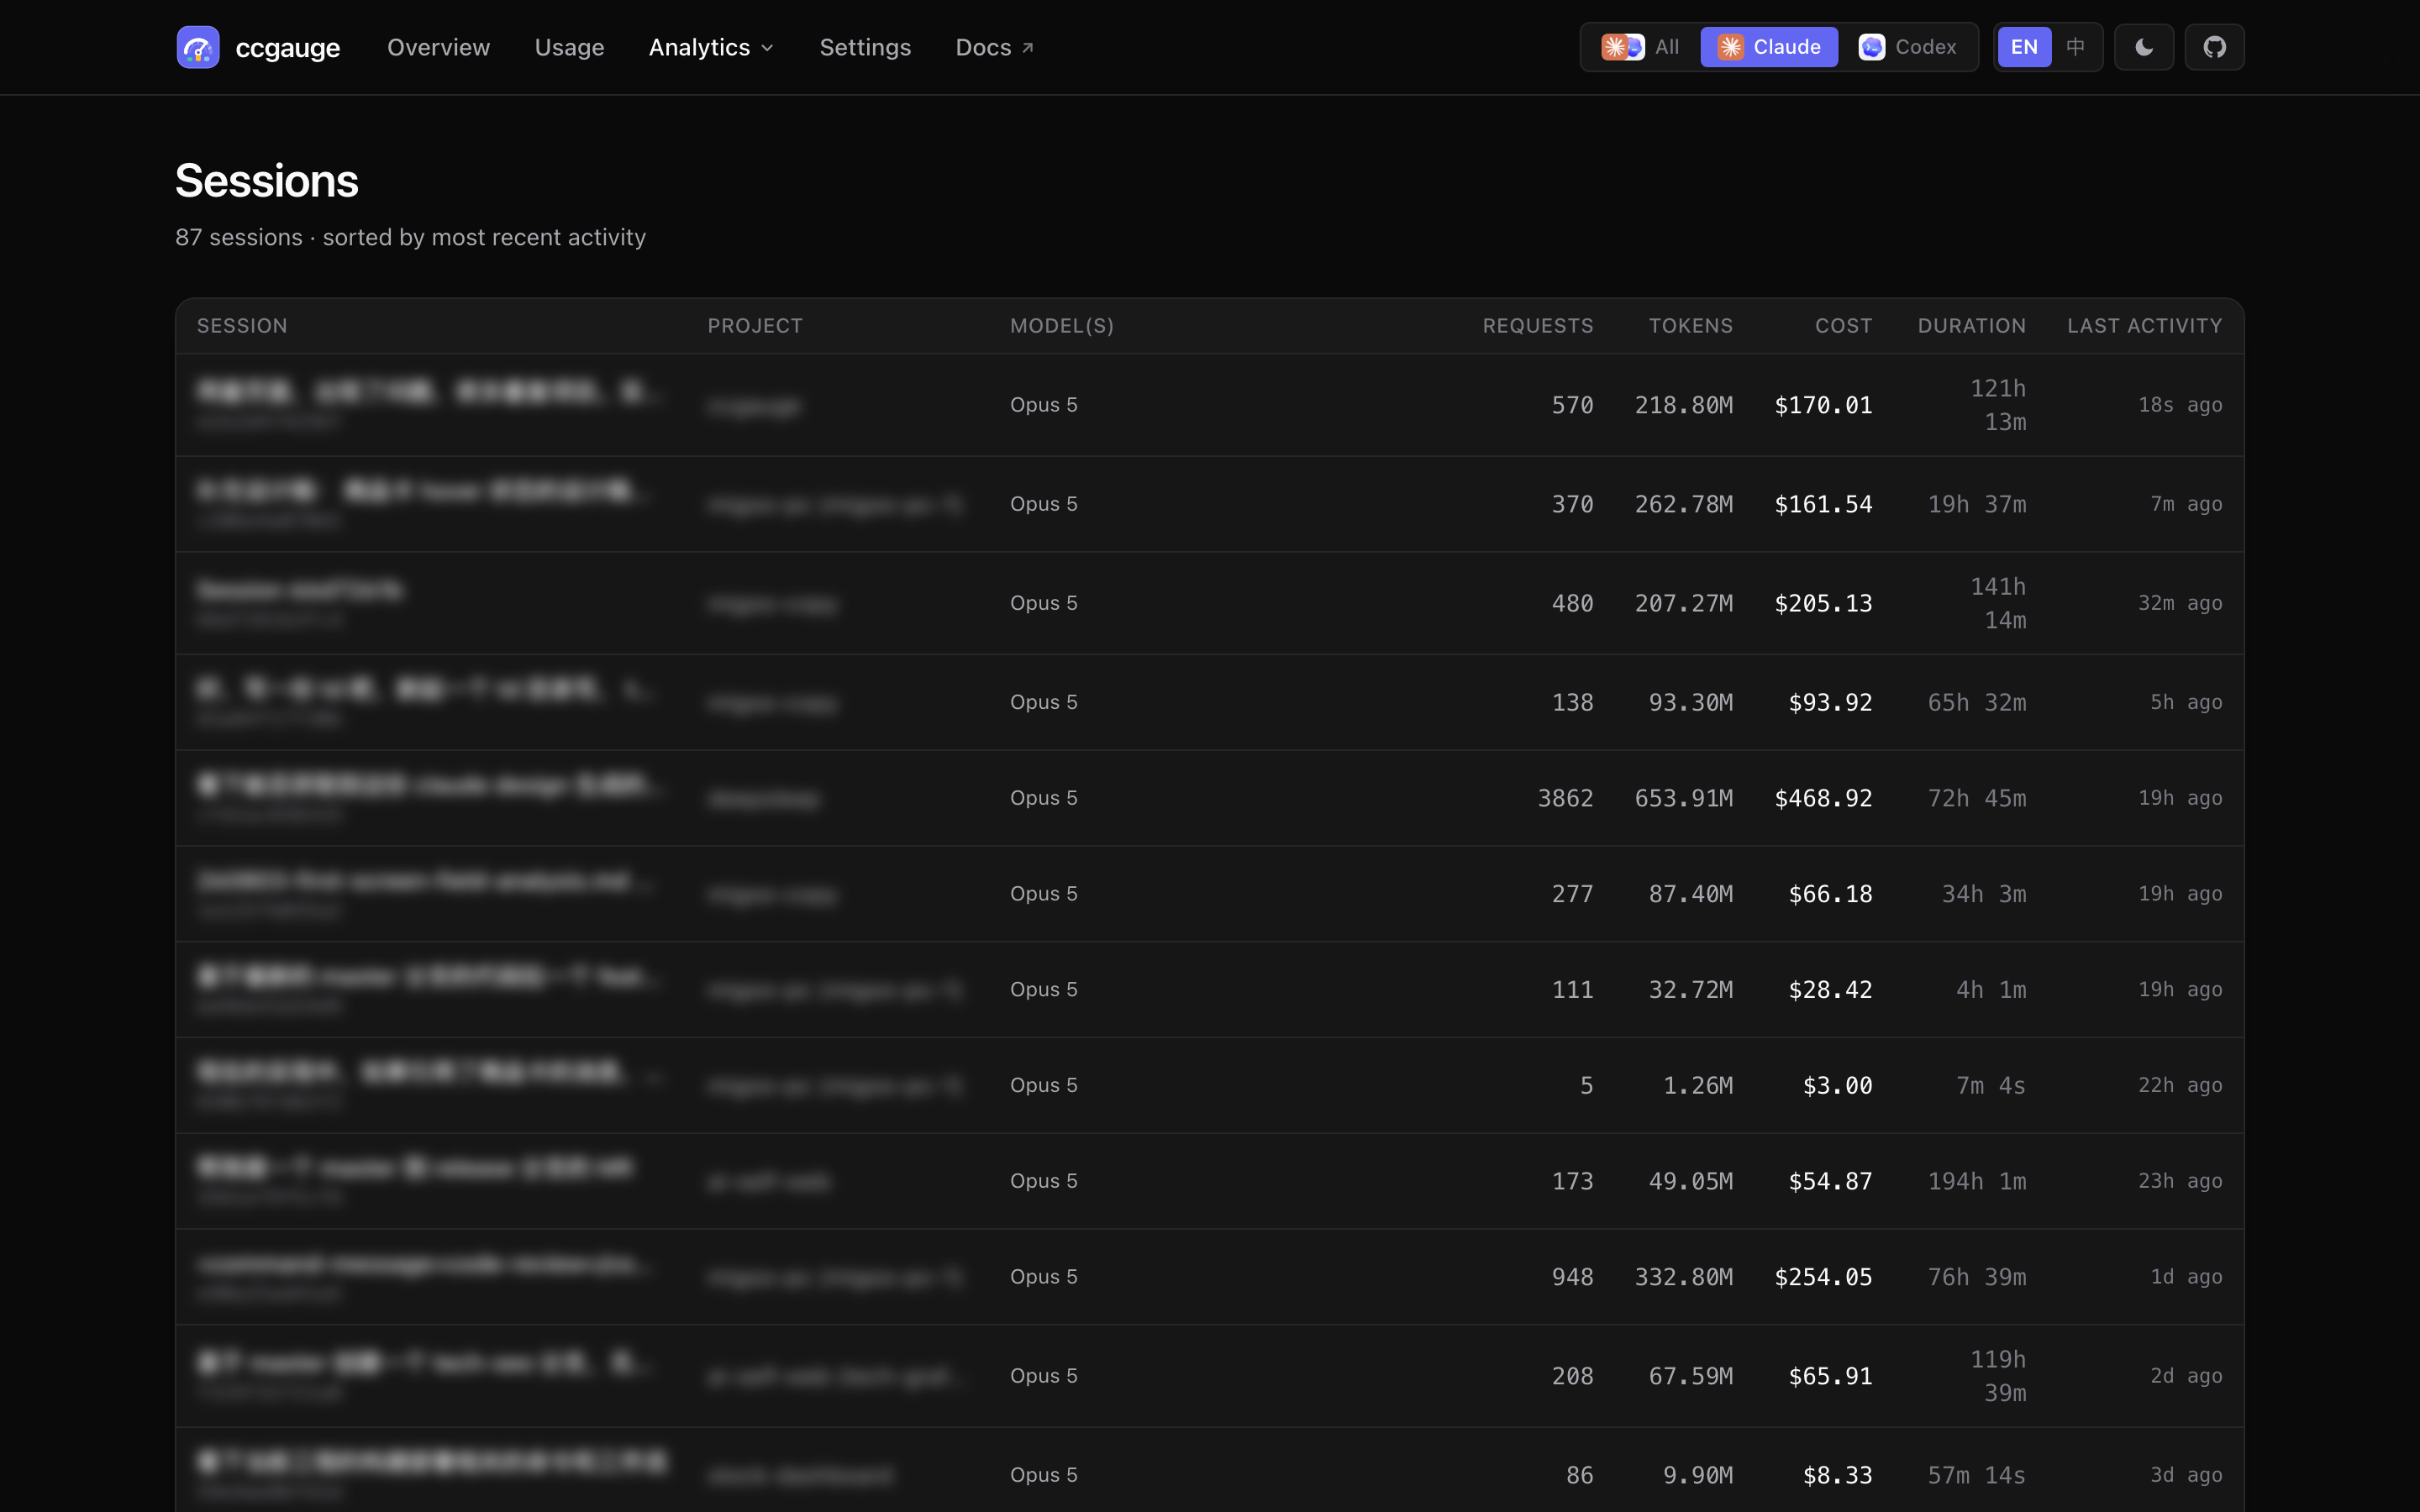
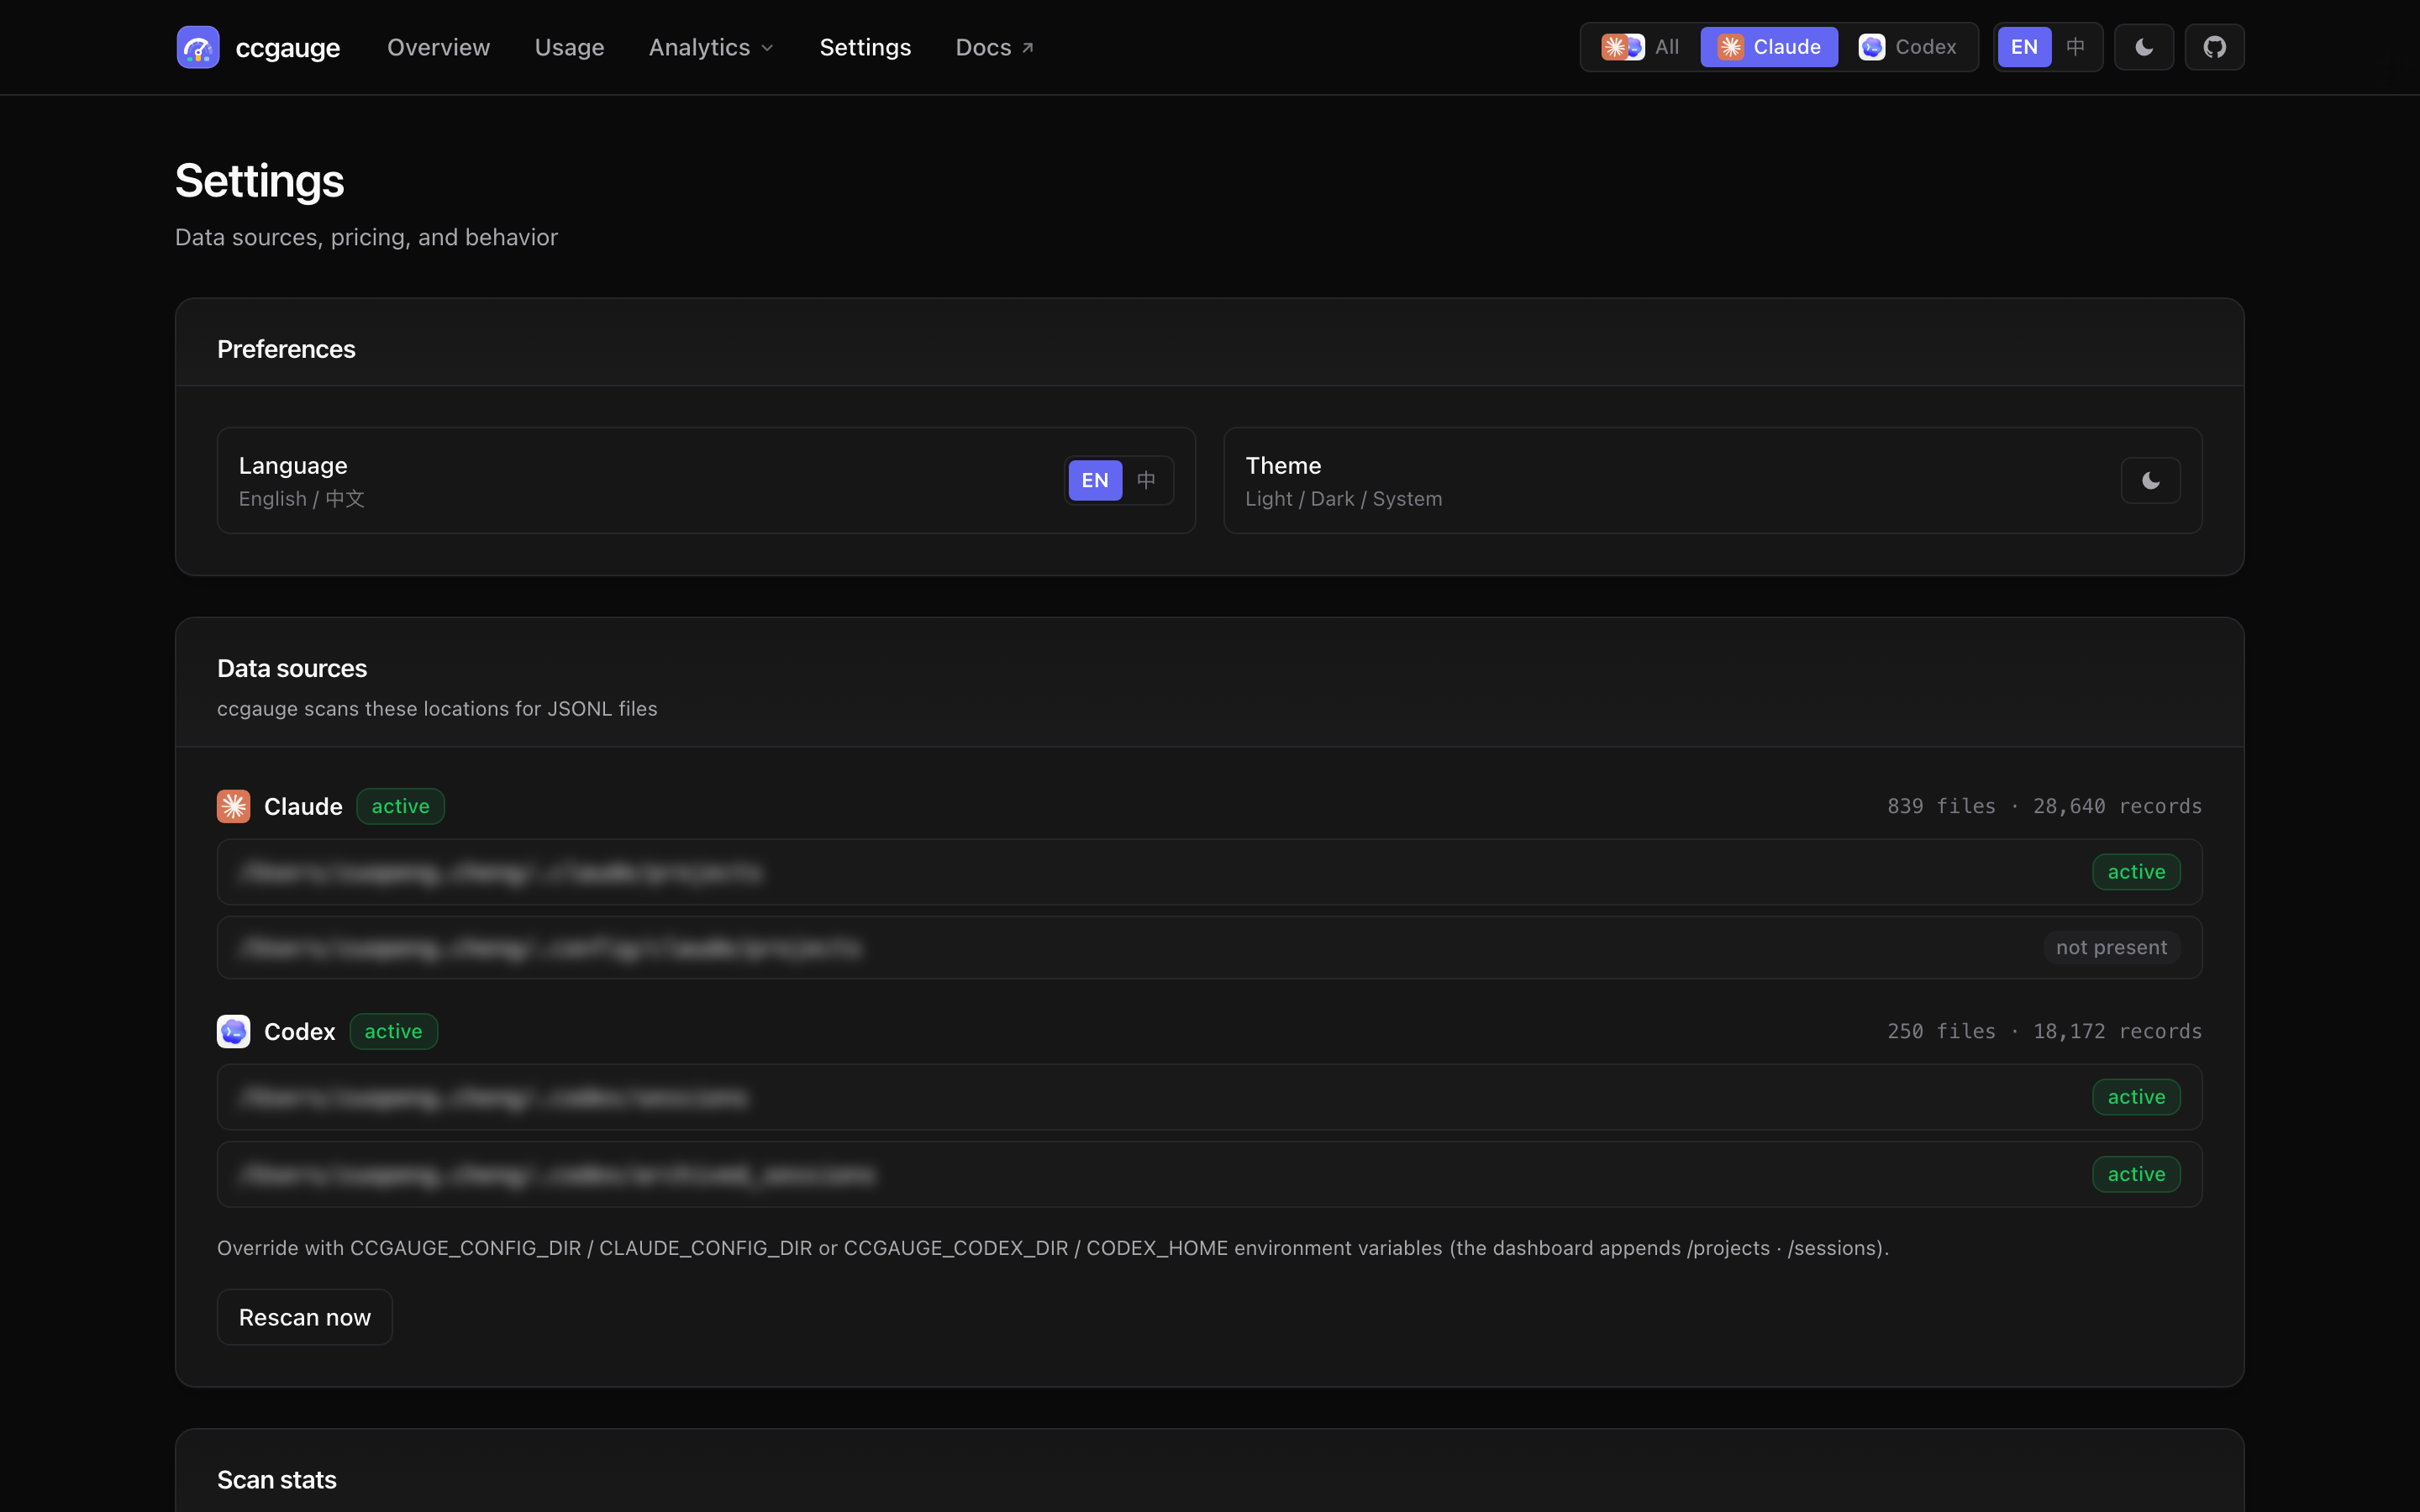
A single Next.js dashboard that understands both Claude Code (Anthropic) and OpenAI Codex CLI. The top-of-nav switcher offers three states — Claude, Codex, or All (merged) — each rendered with the real provider logo. URL and cookie remember your choice across reloads and tabs.
- Tri-state source switcher:
Allmerges Claude + Codex totals viacombineTotals/combineTimeBucketsso cross-provider summaries stay one query - Overview — KPI cards (today's tokens, this month, today's top, top model) + token-by-source trend chart
- Usage — per-turn / per-call table with prompt preview, tool list, duration, cost, search and filters. Trend chart toggles between **Tokens** and **Conversations** (per-day turn count)
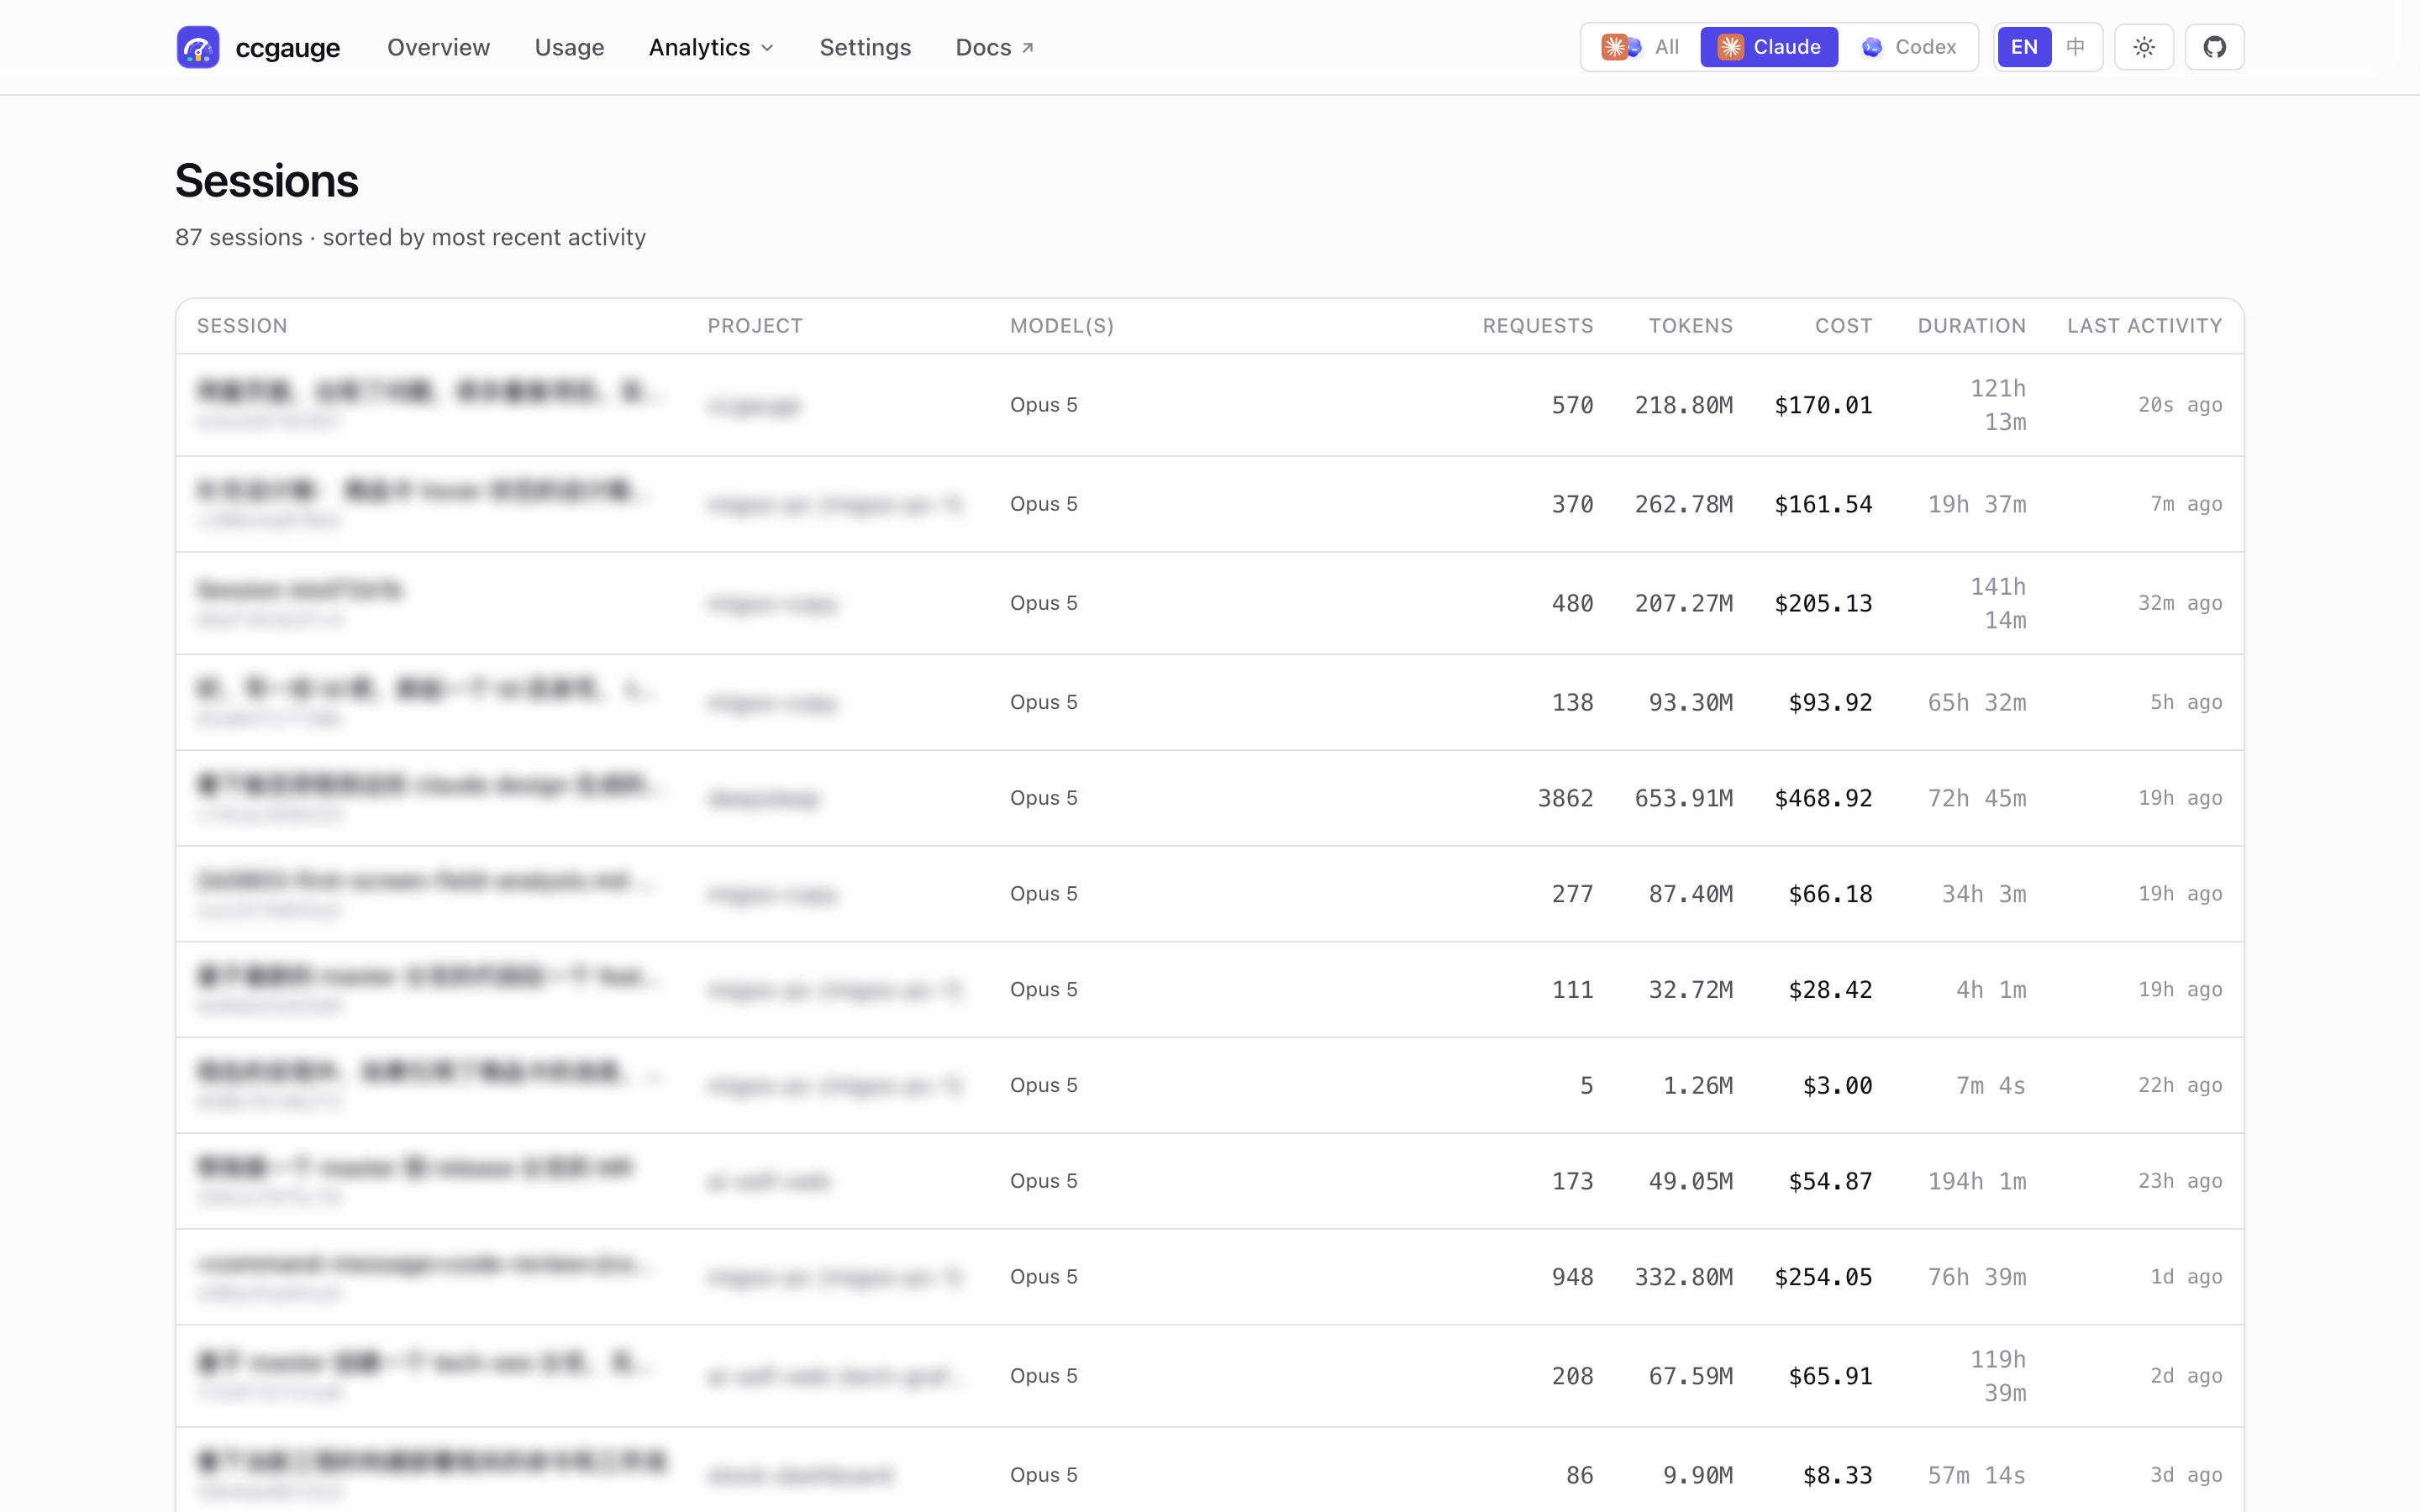
- Sessions — drill into a single conversation, see model usage and message timeline
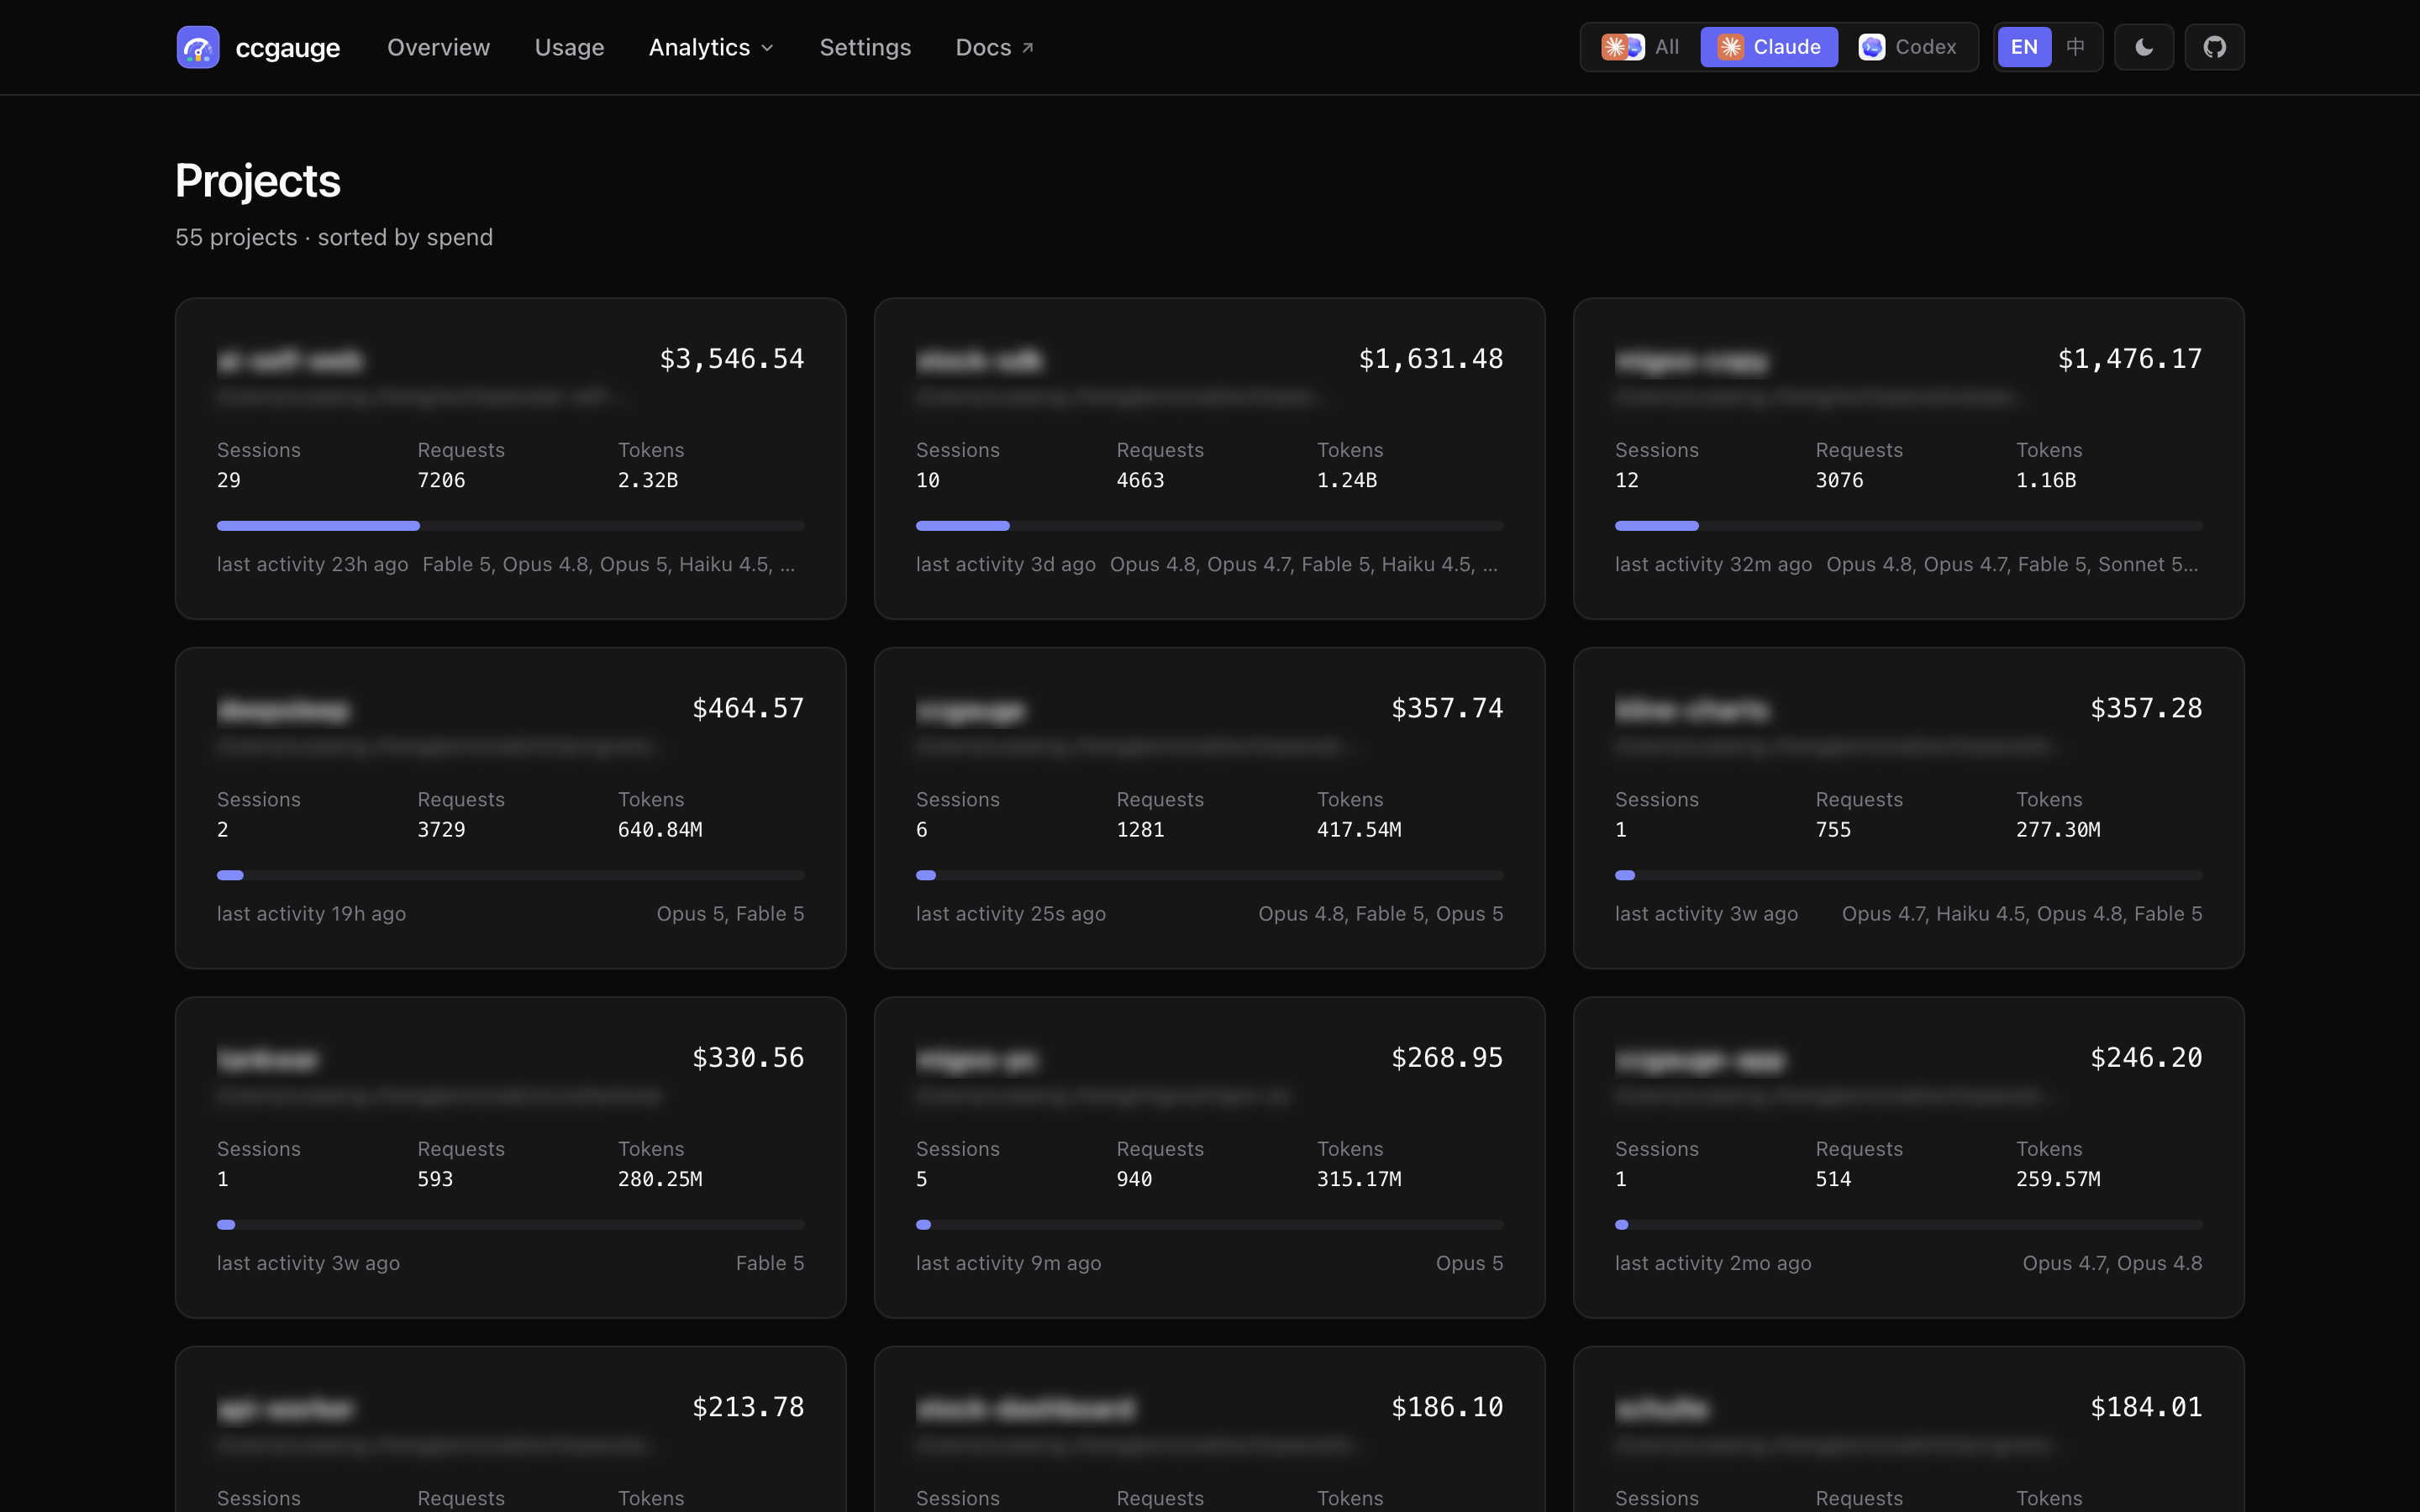
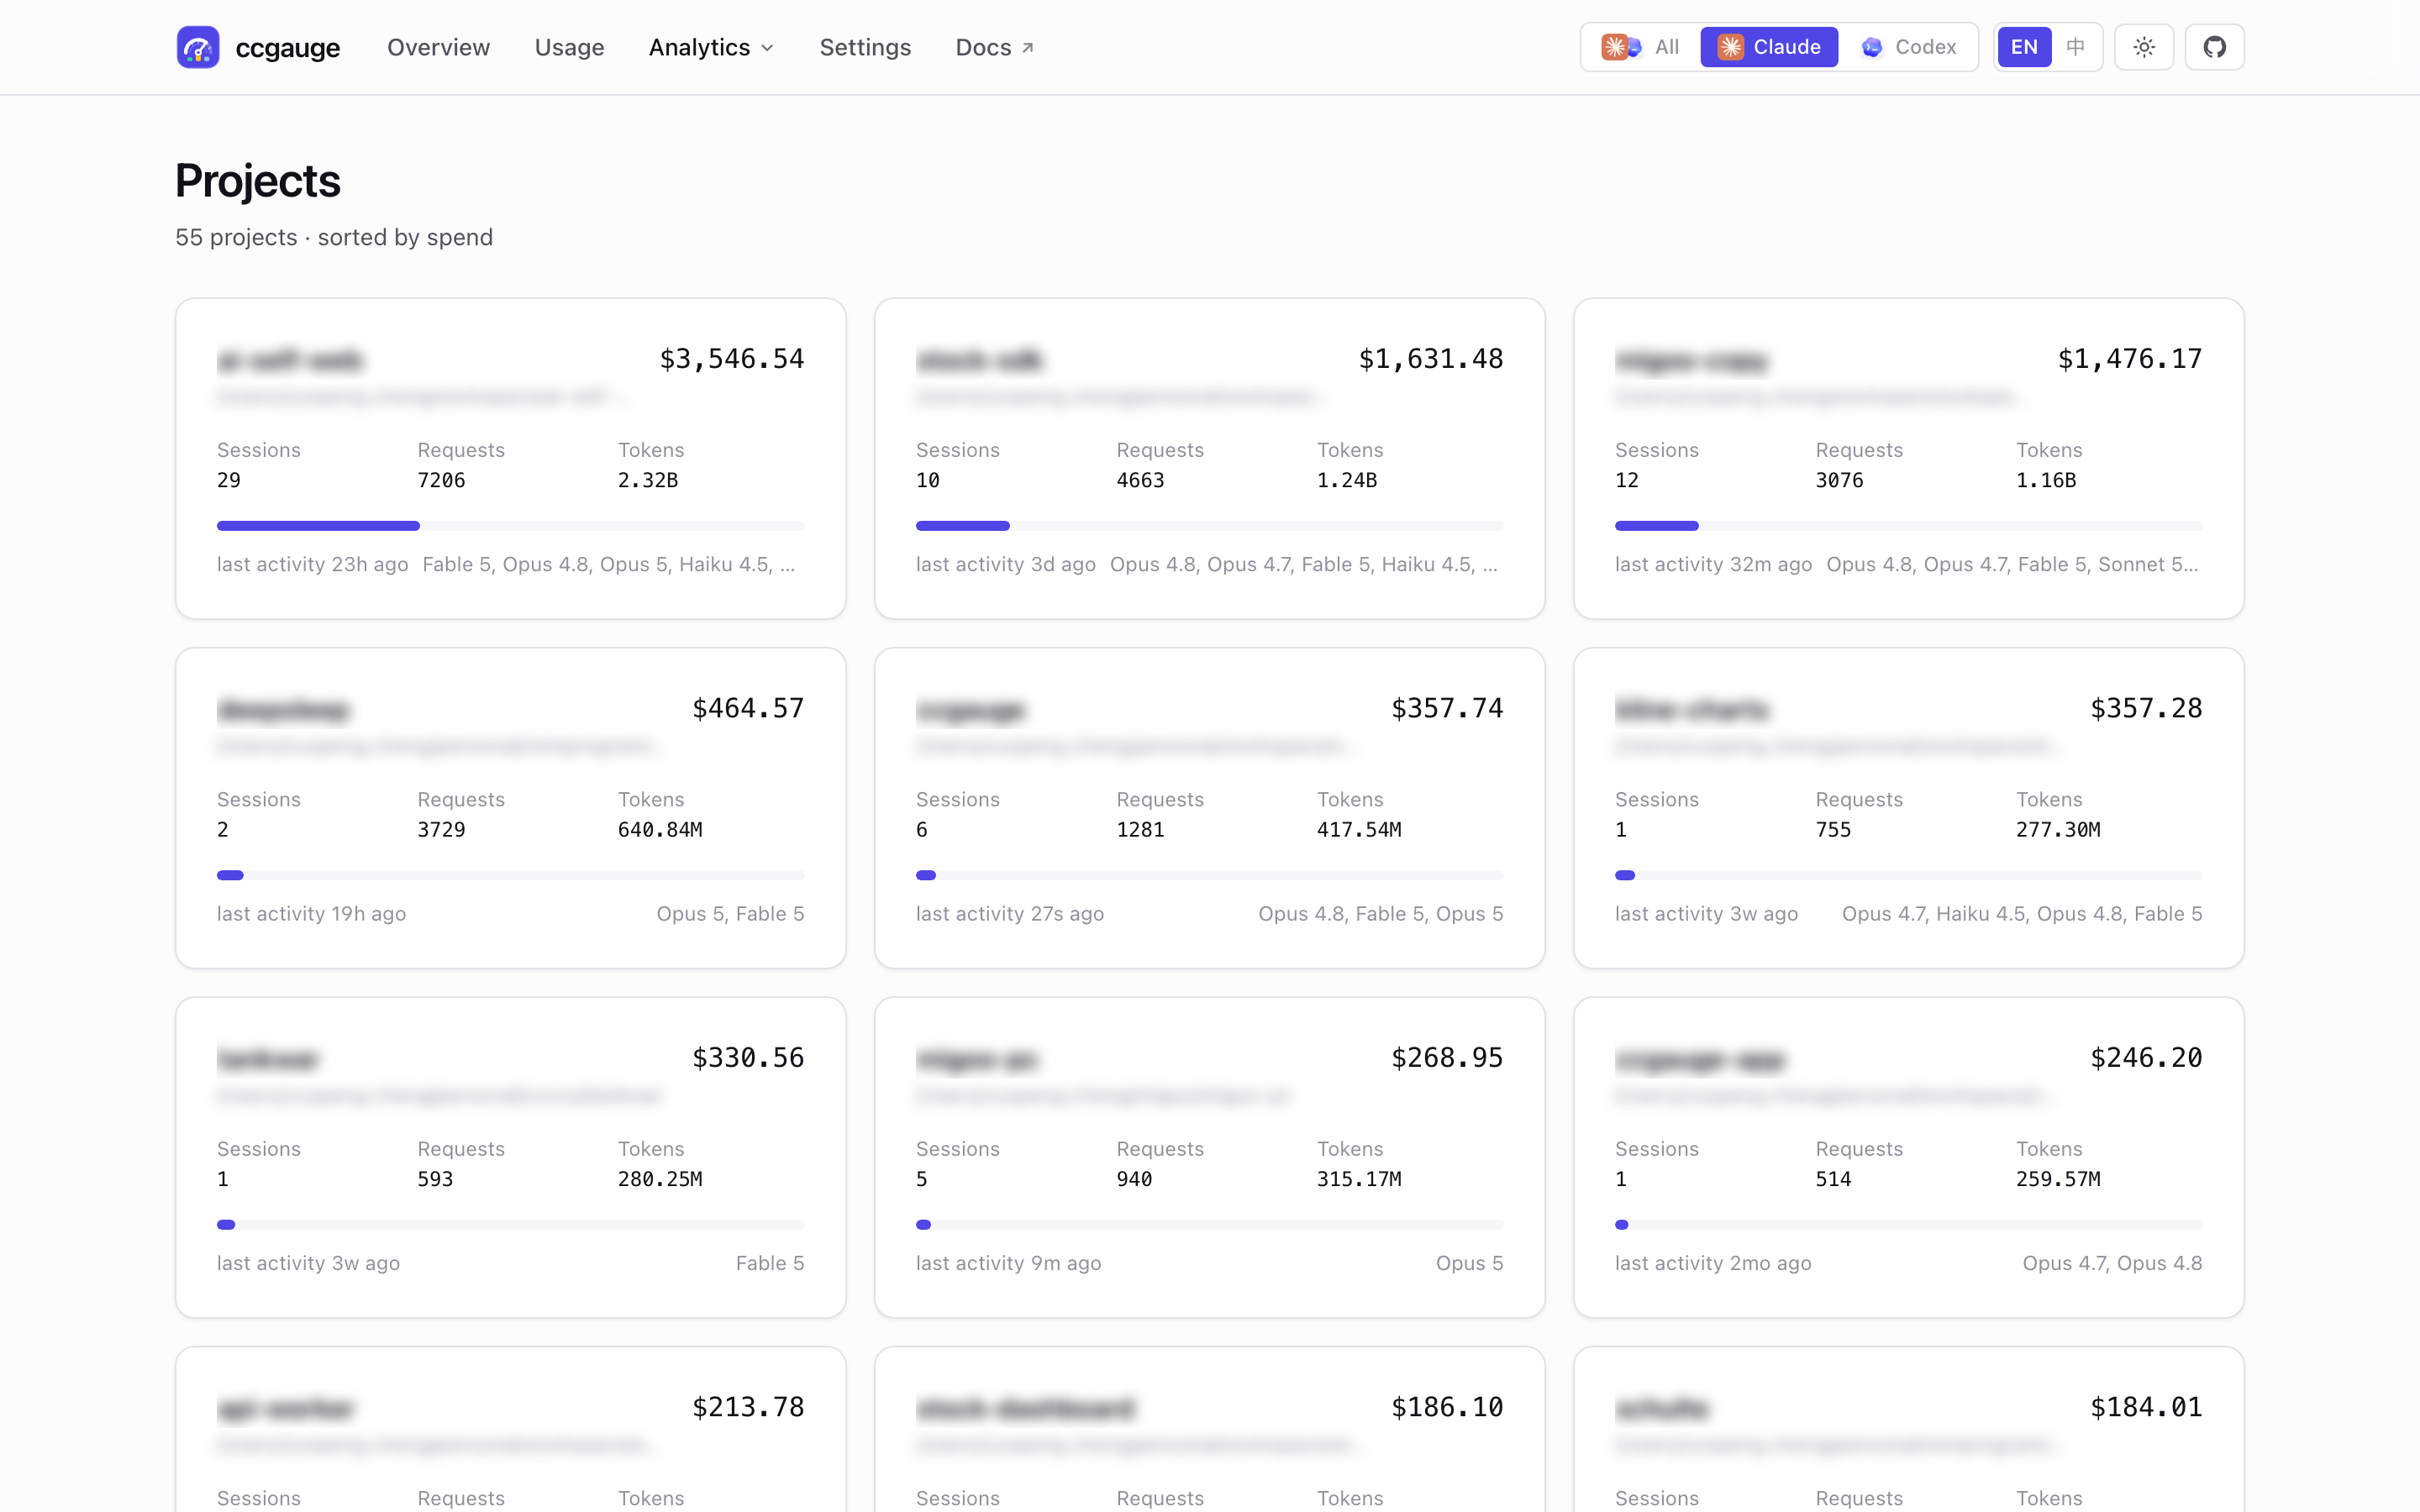
- Projects — per-cwd spend, worktree-aware: all worktrees of the same repo collapse into one project row, regardless of
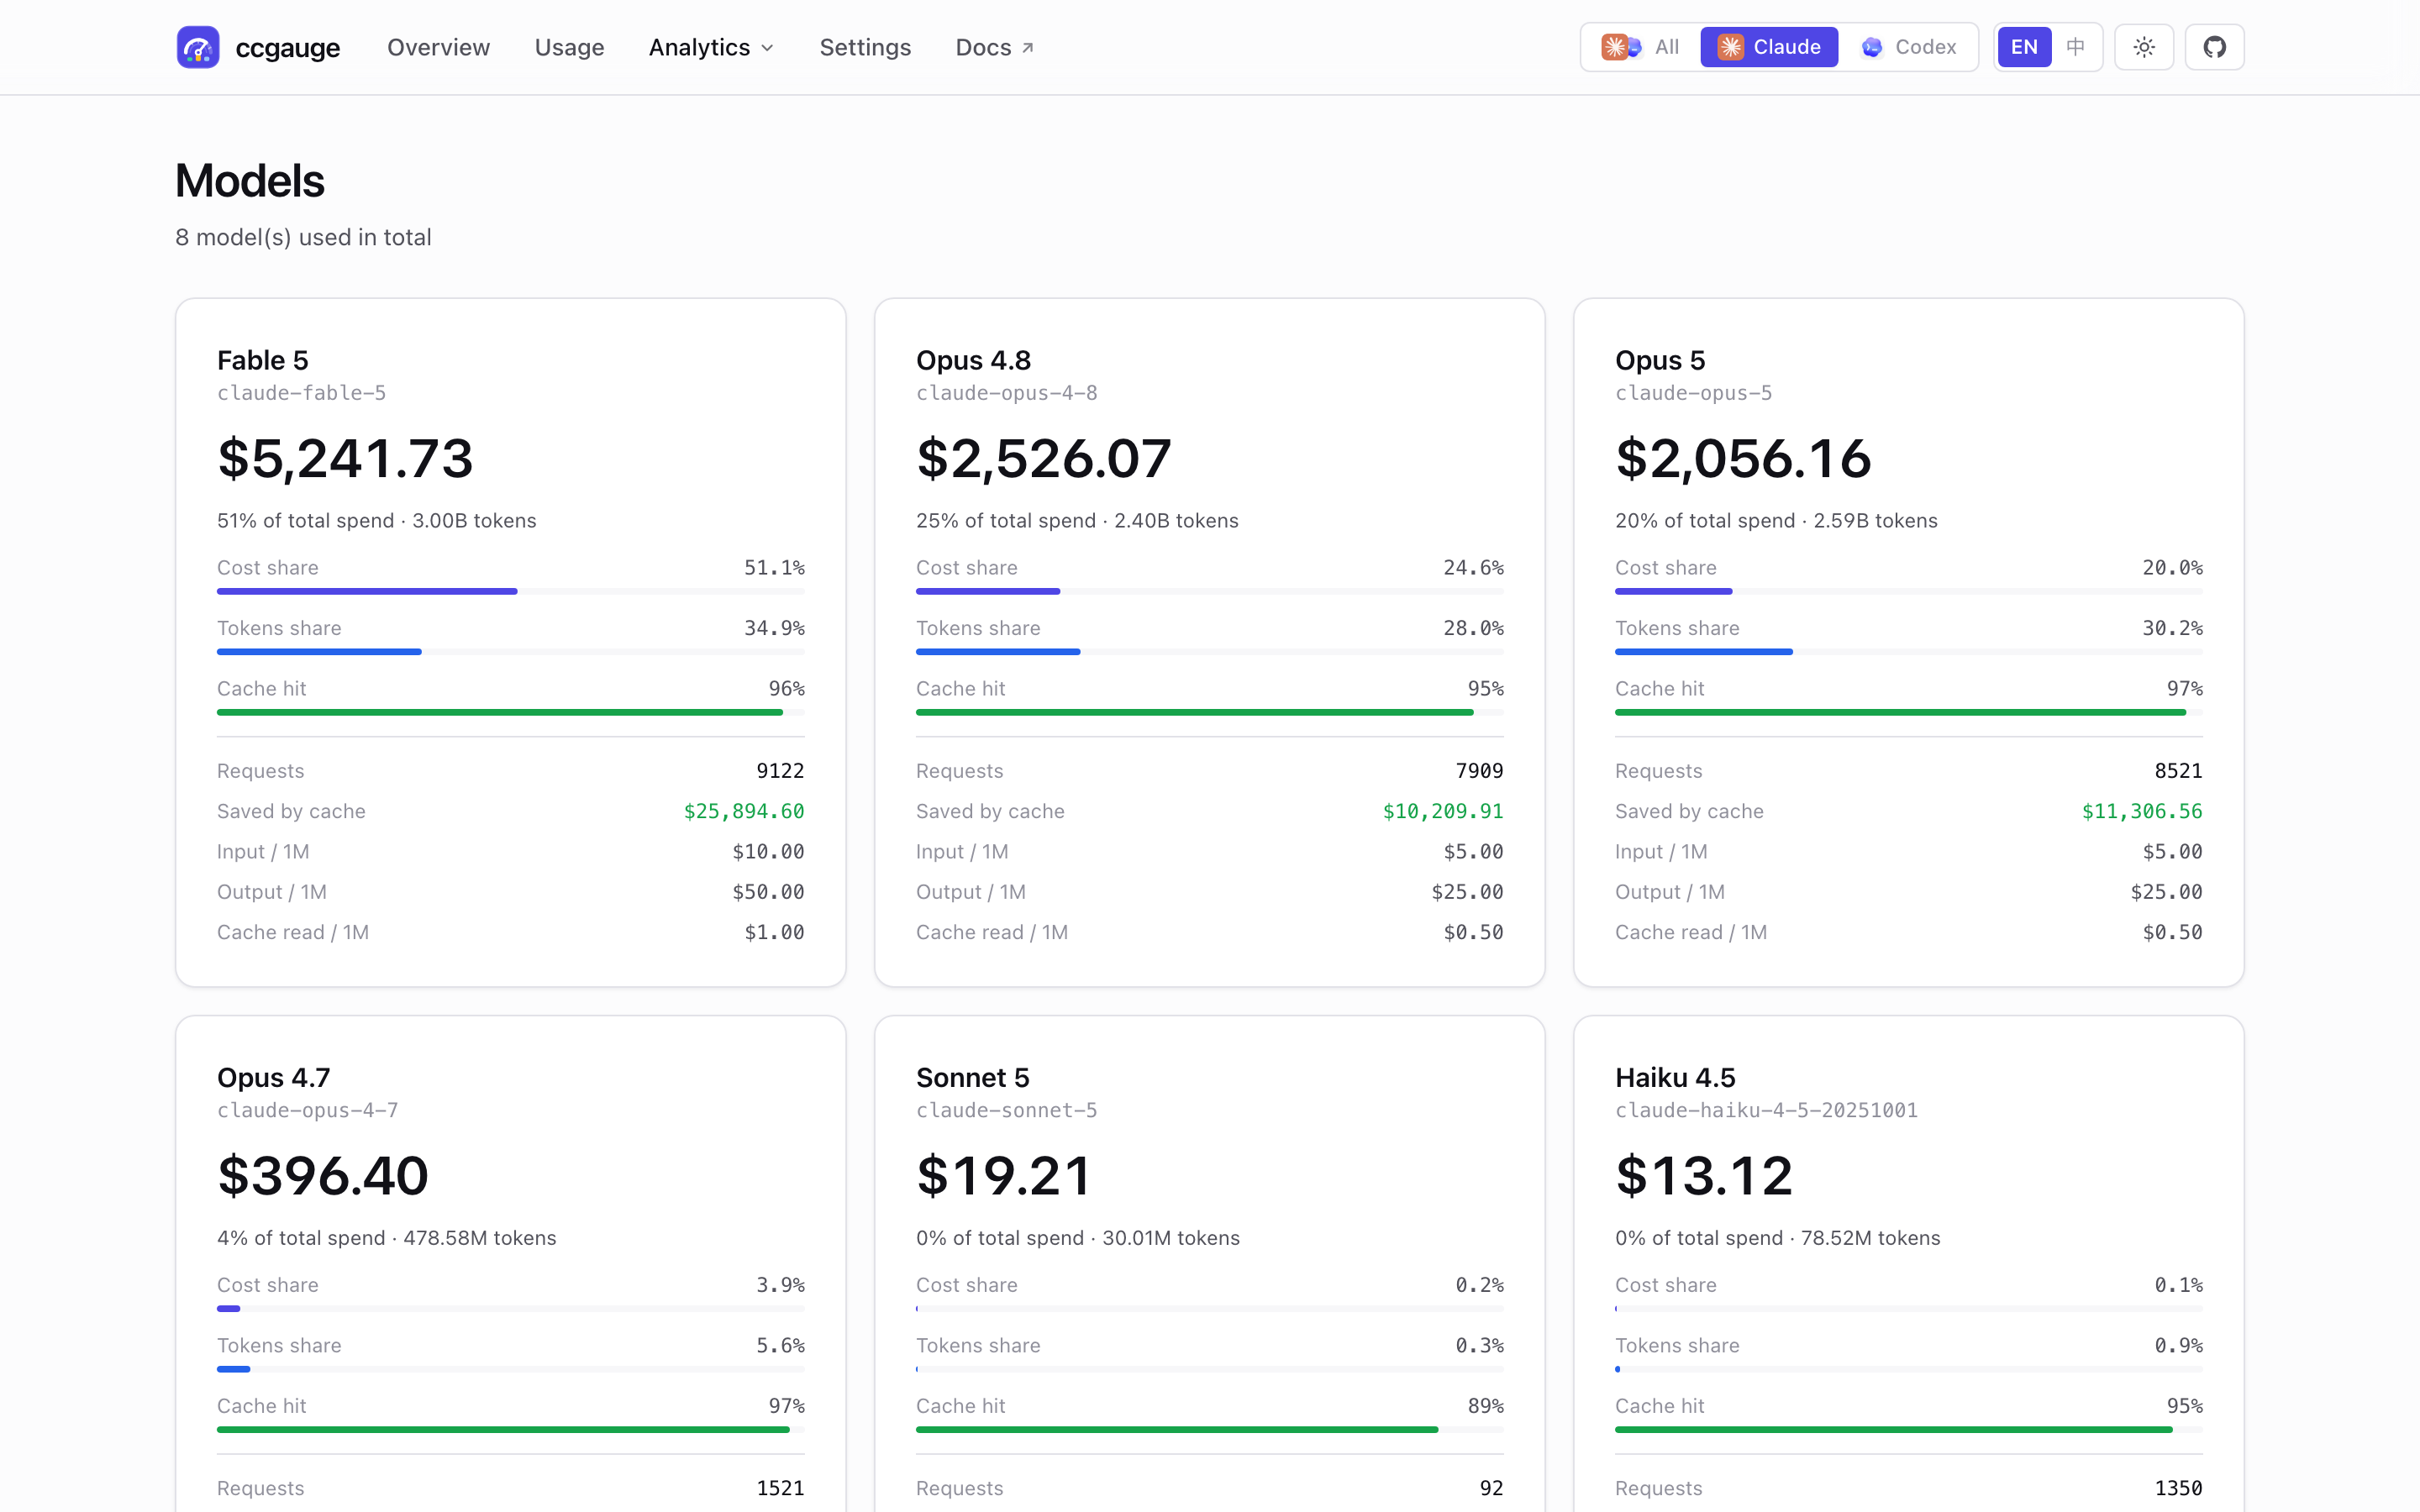
git worktreeor.claude/worktrees/layout - Models — side-by-side comparison with sparkline trends
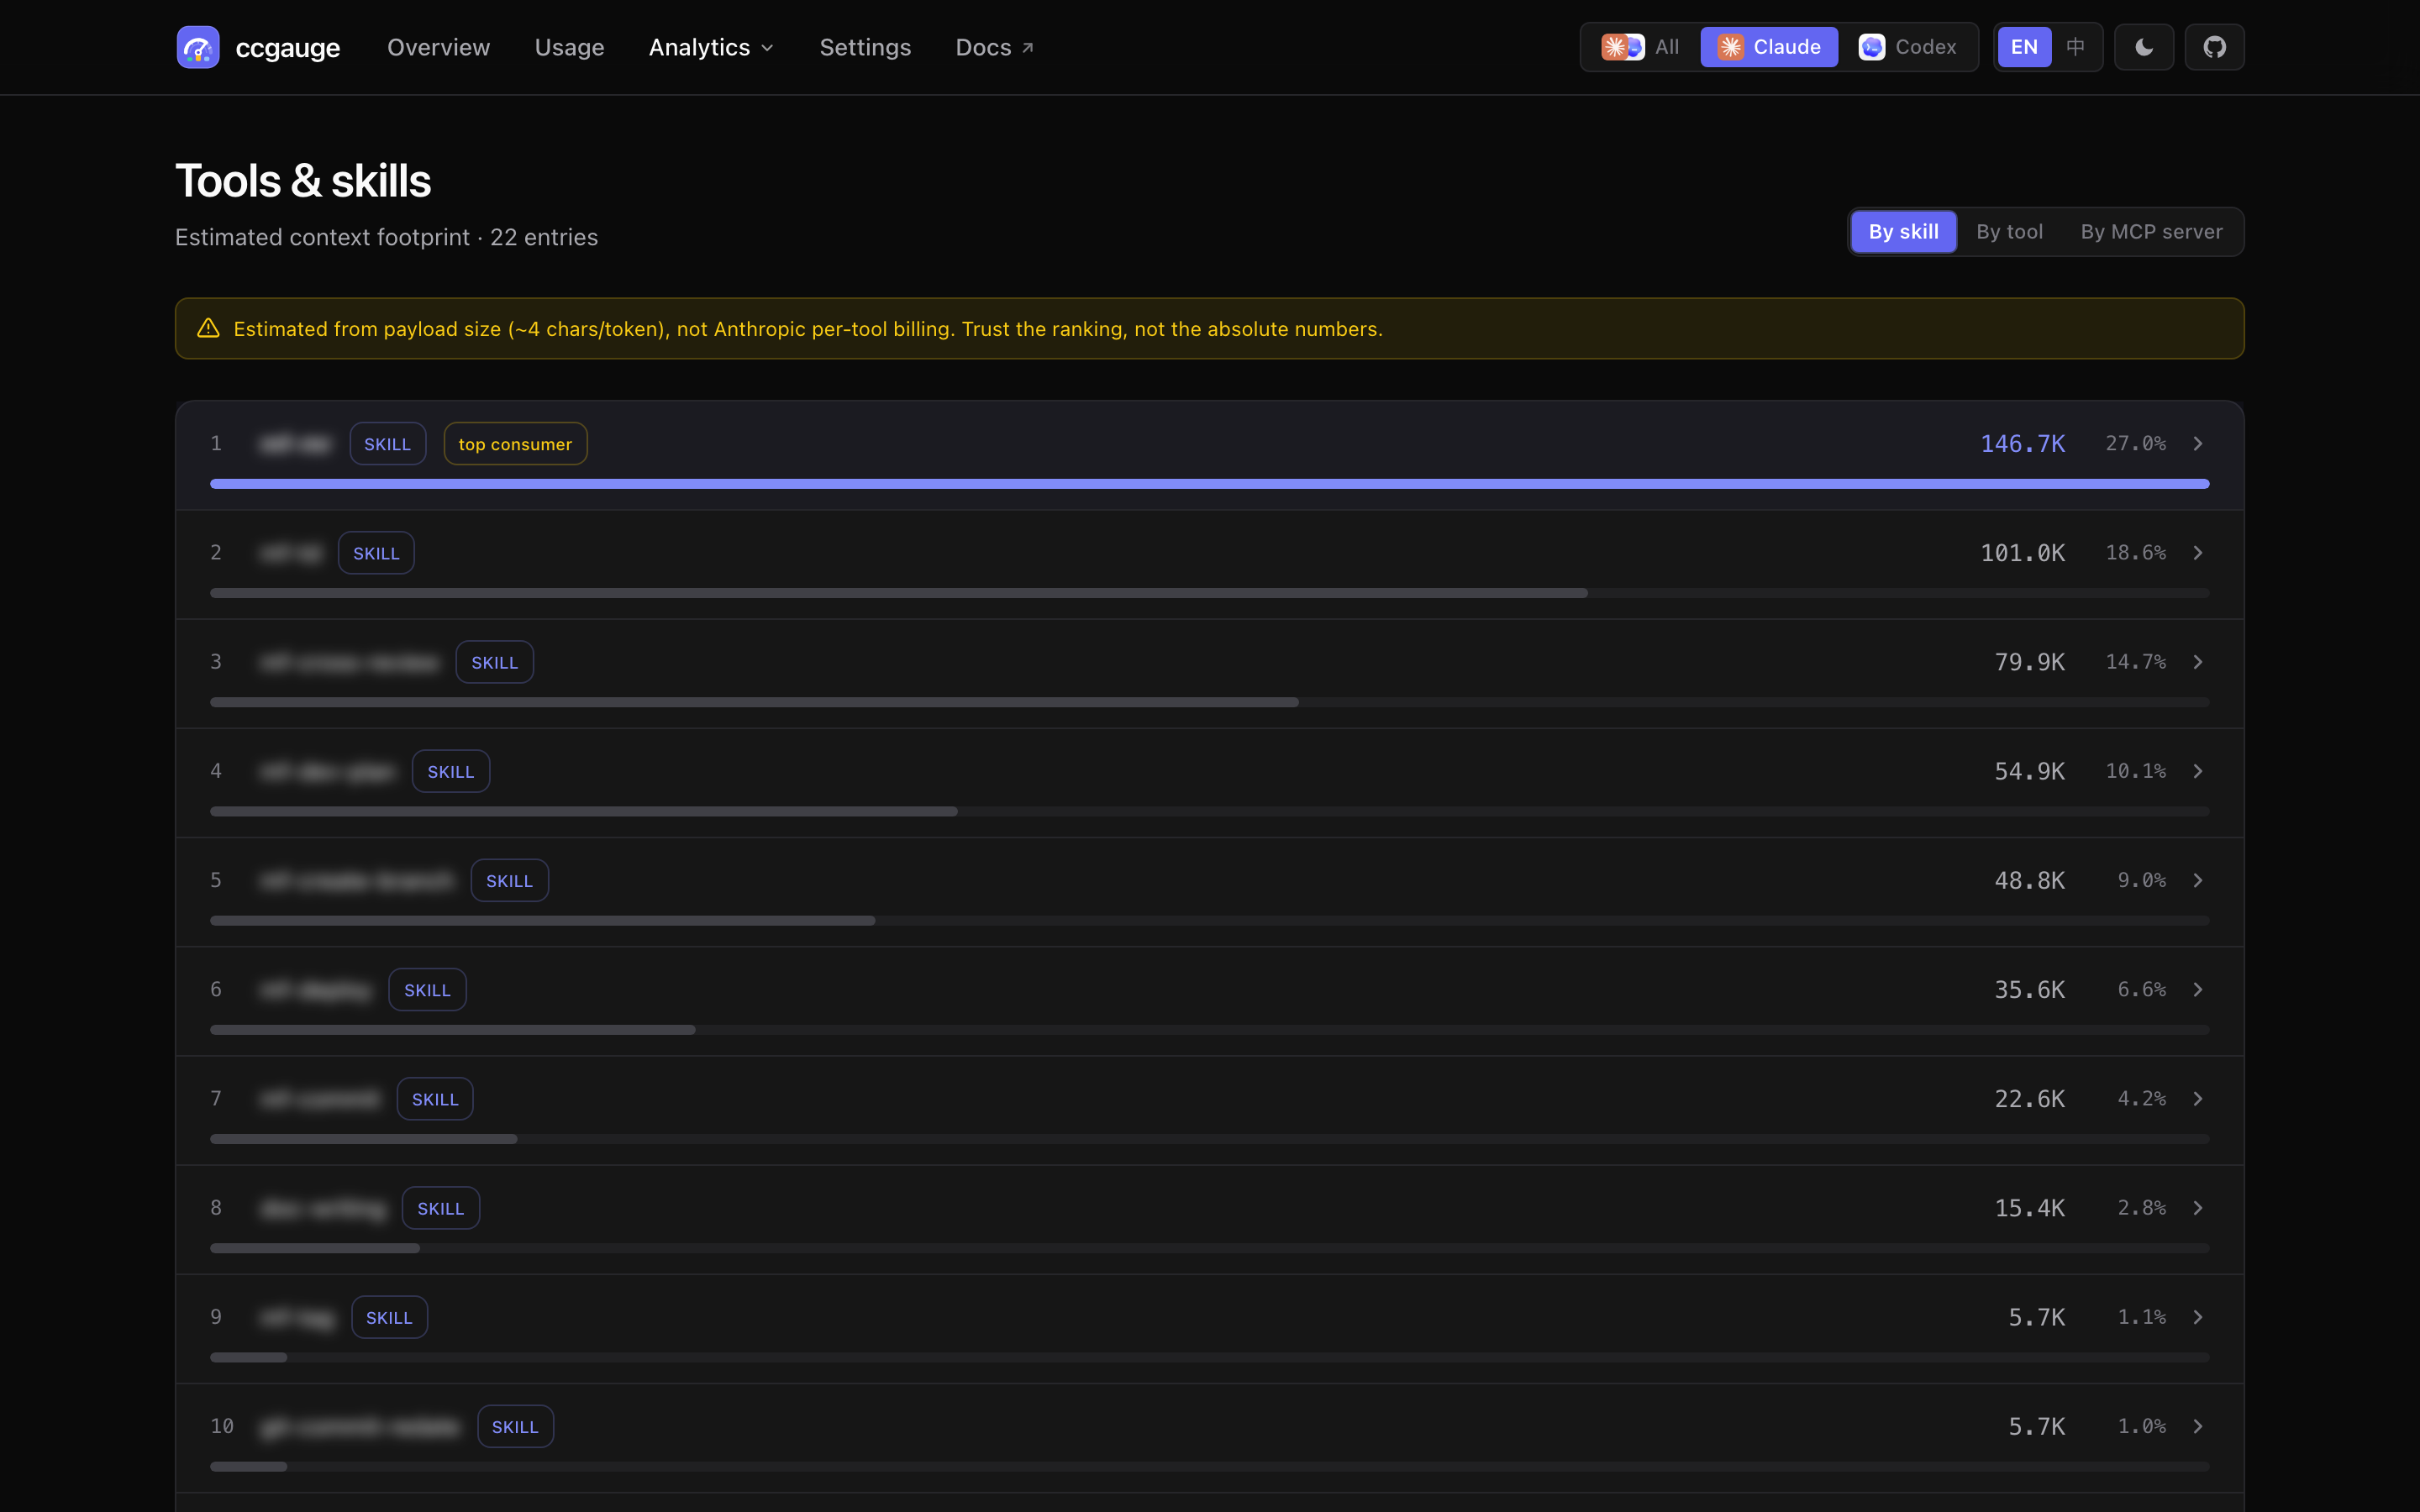
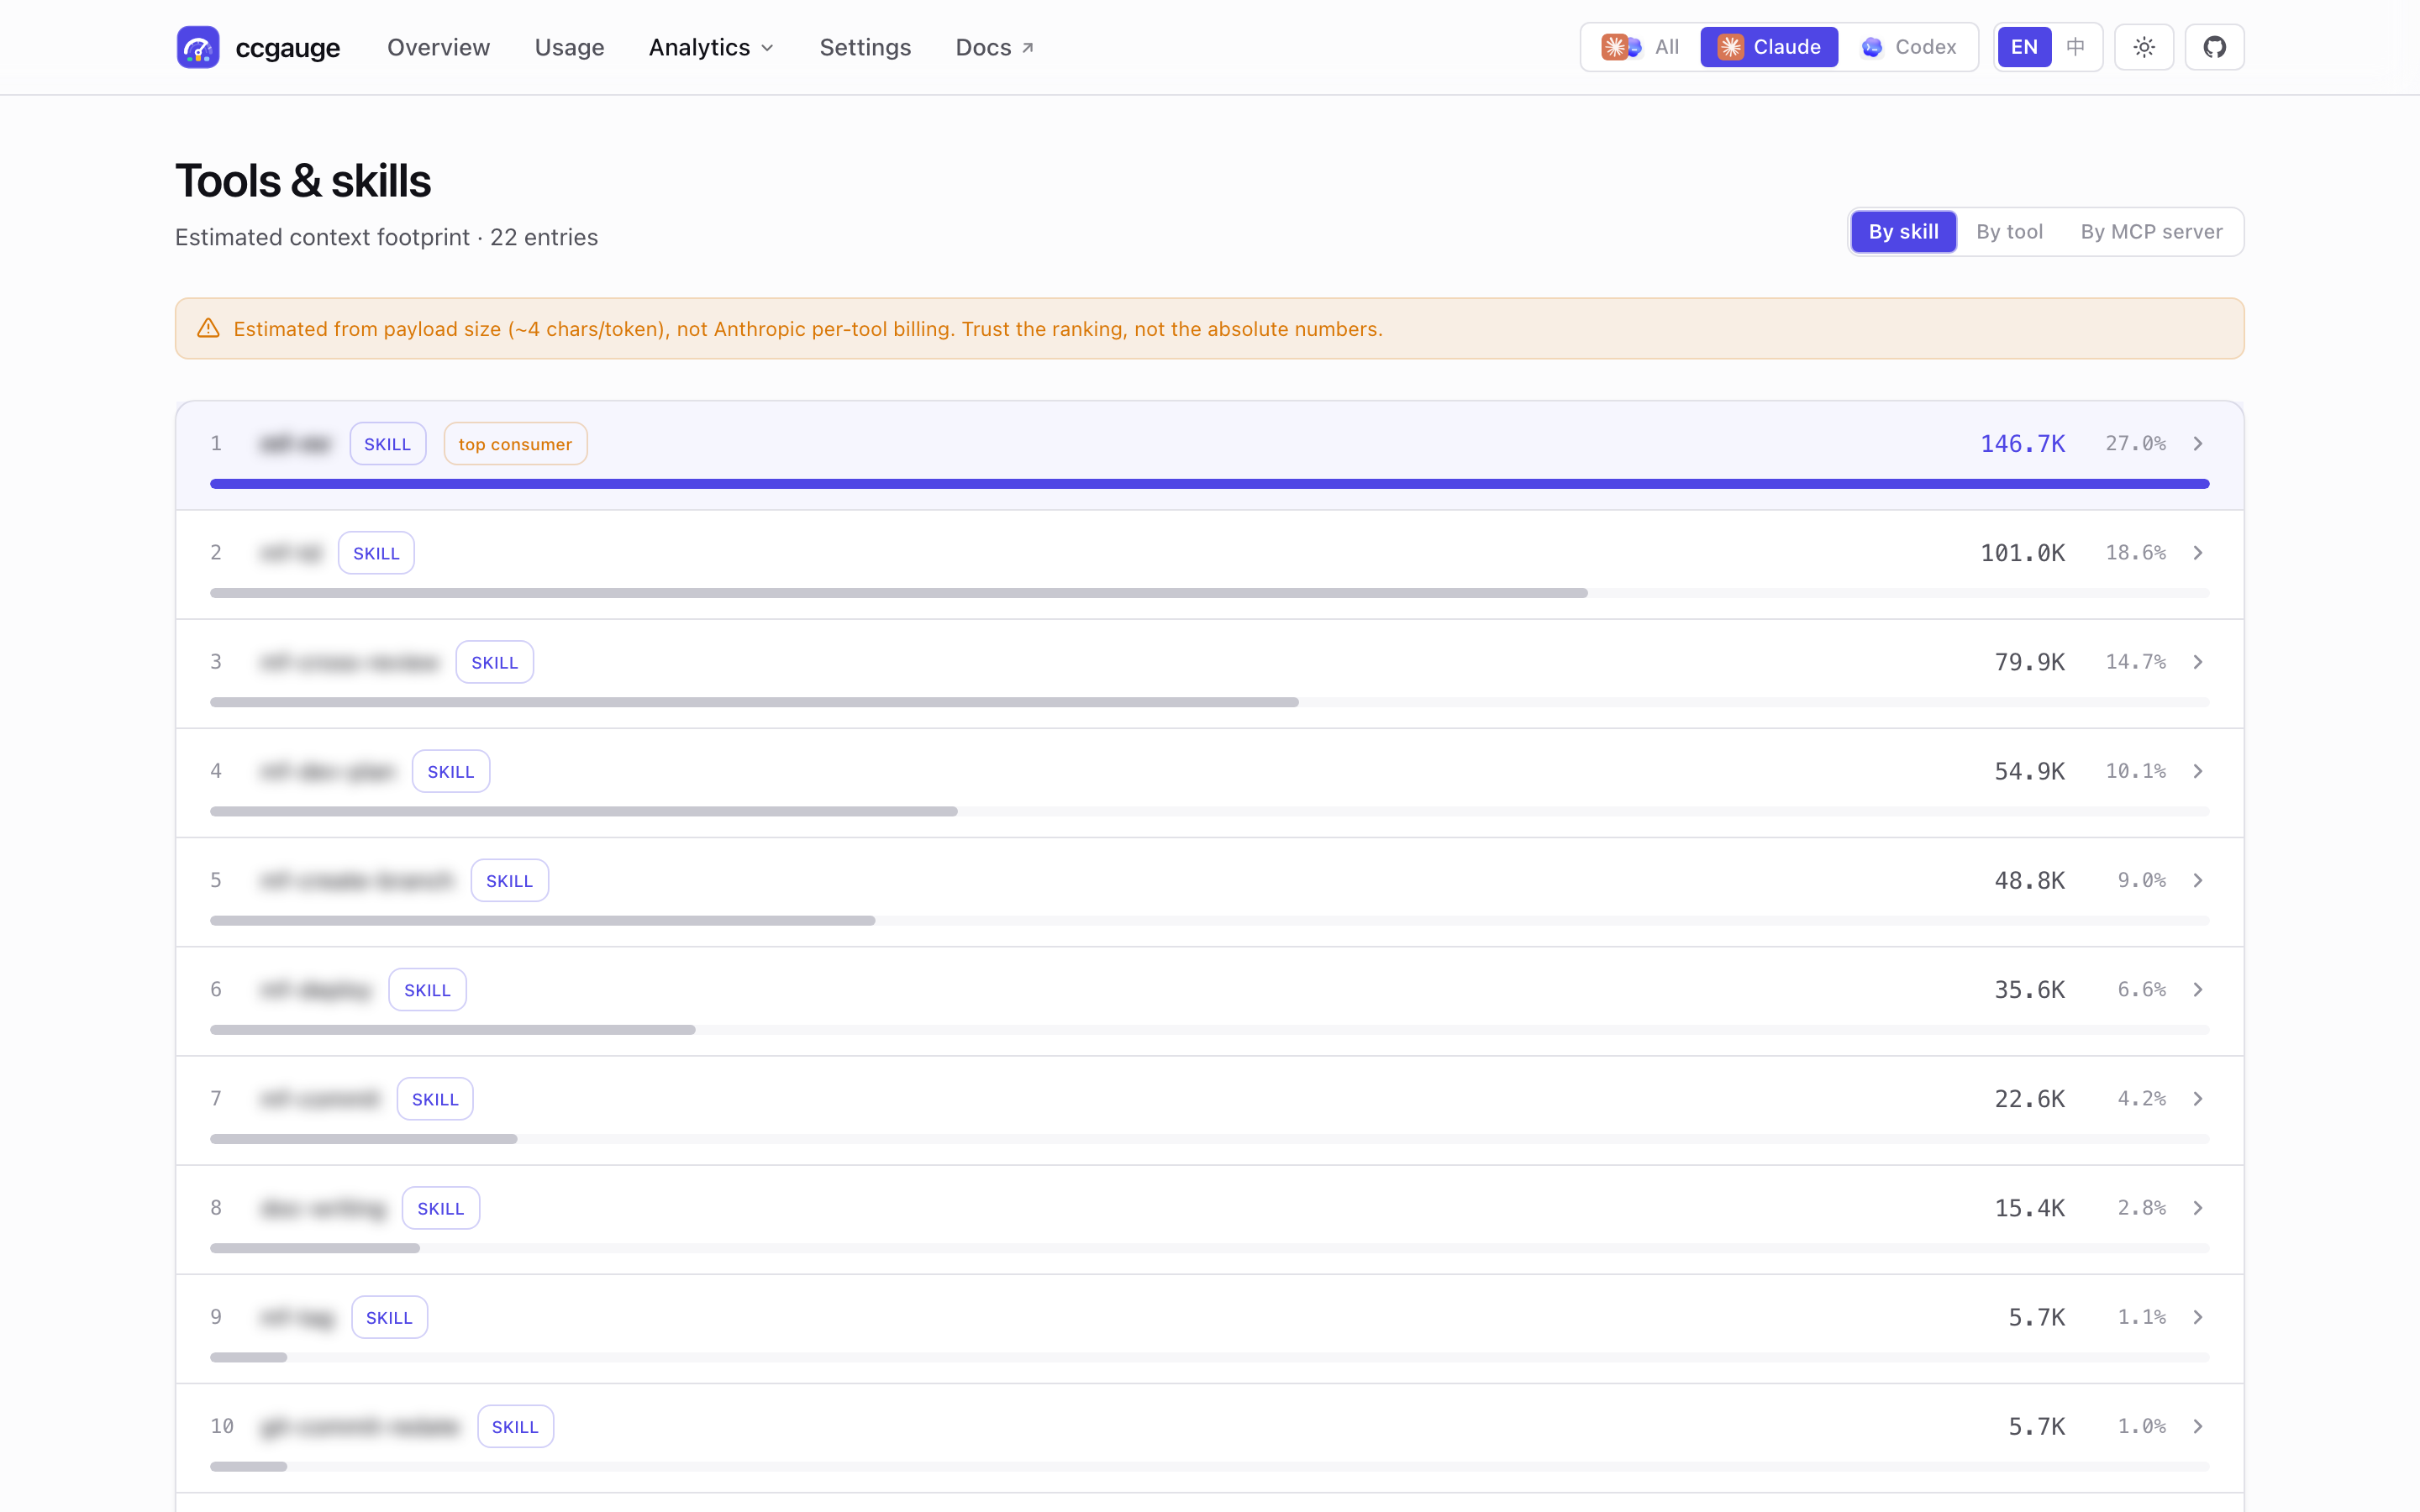
- Tools & skills — every tool, skill and MCP server ranked by estimated context footprint
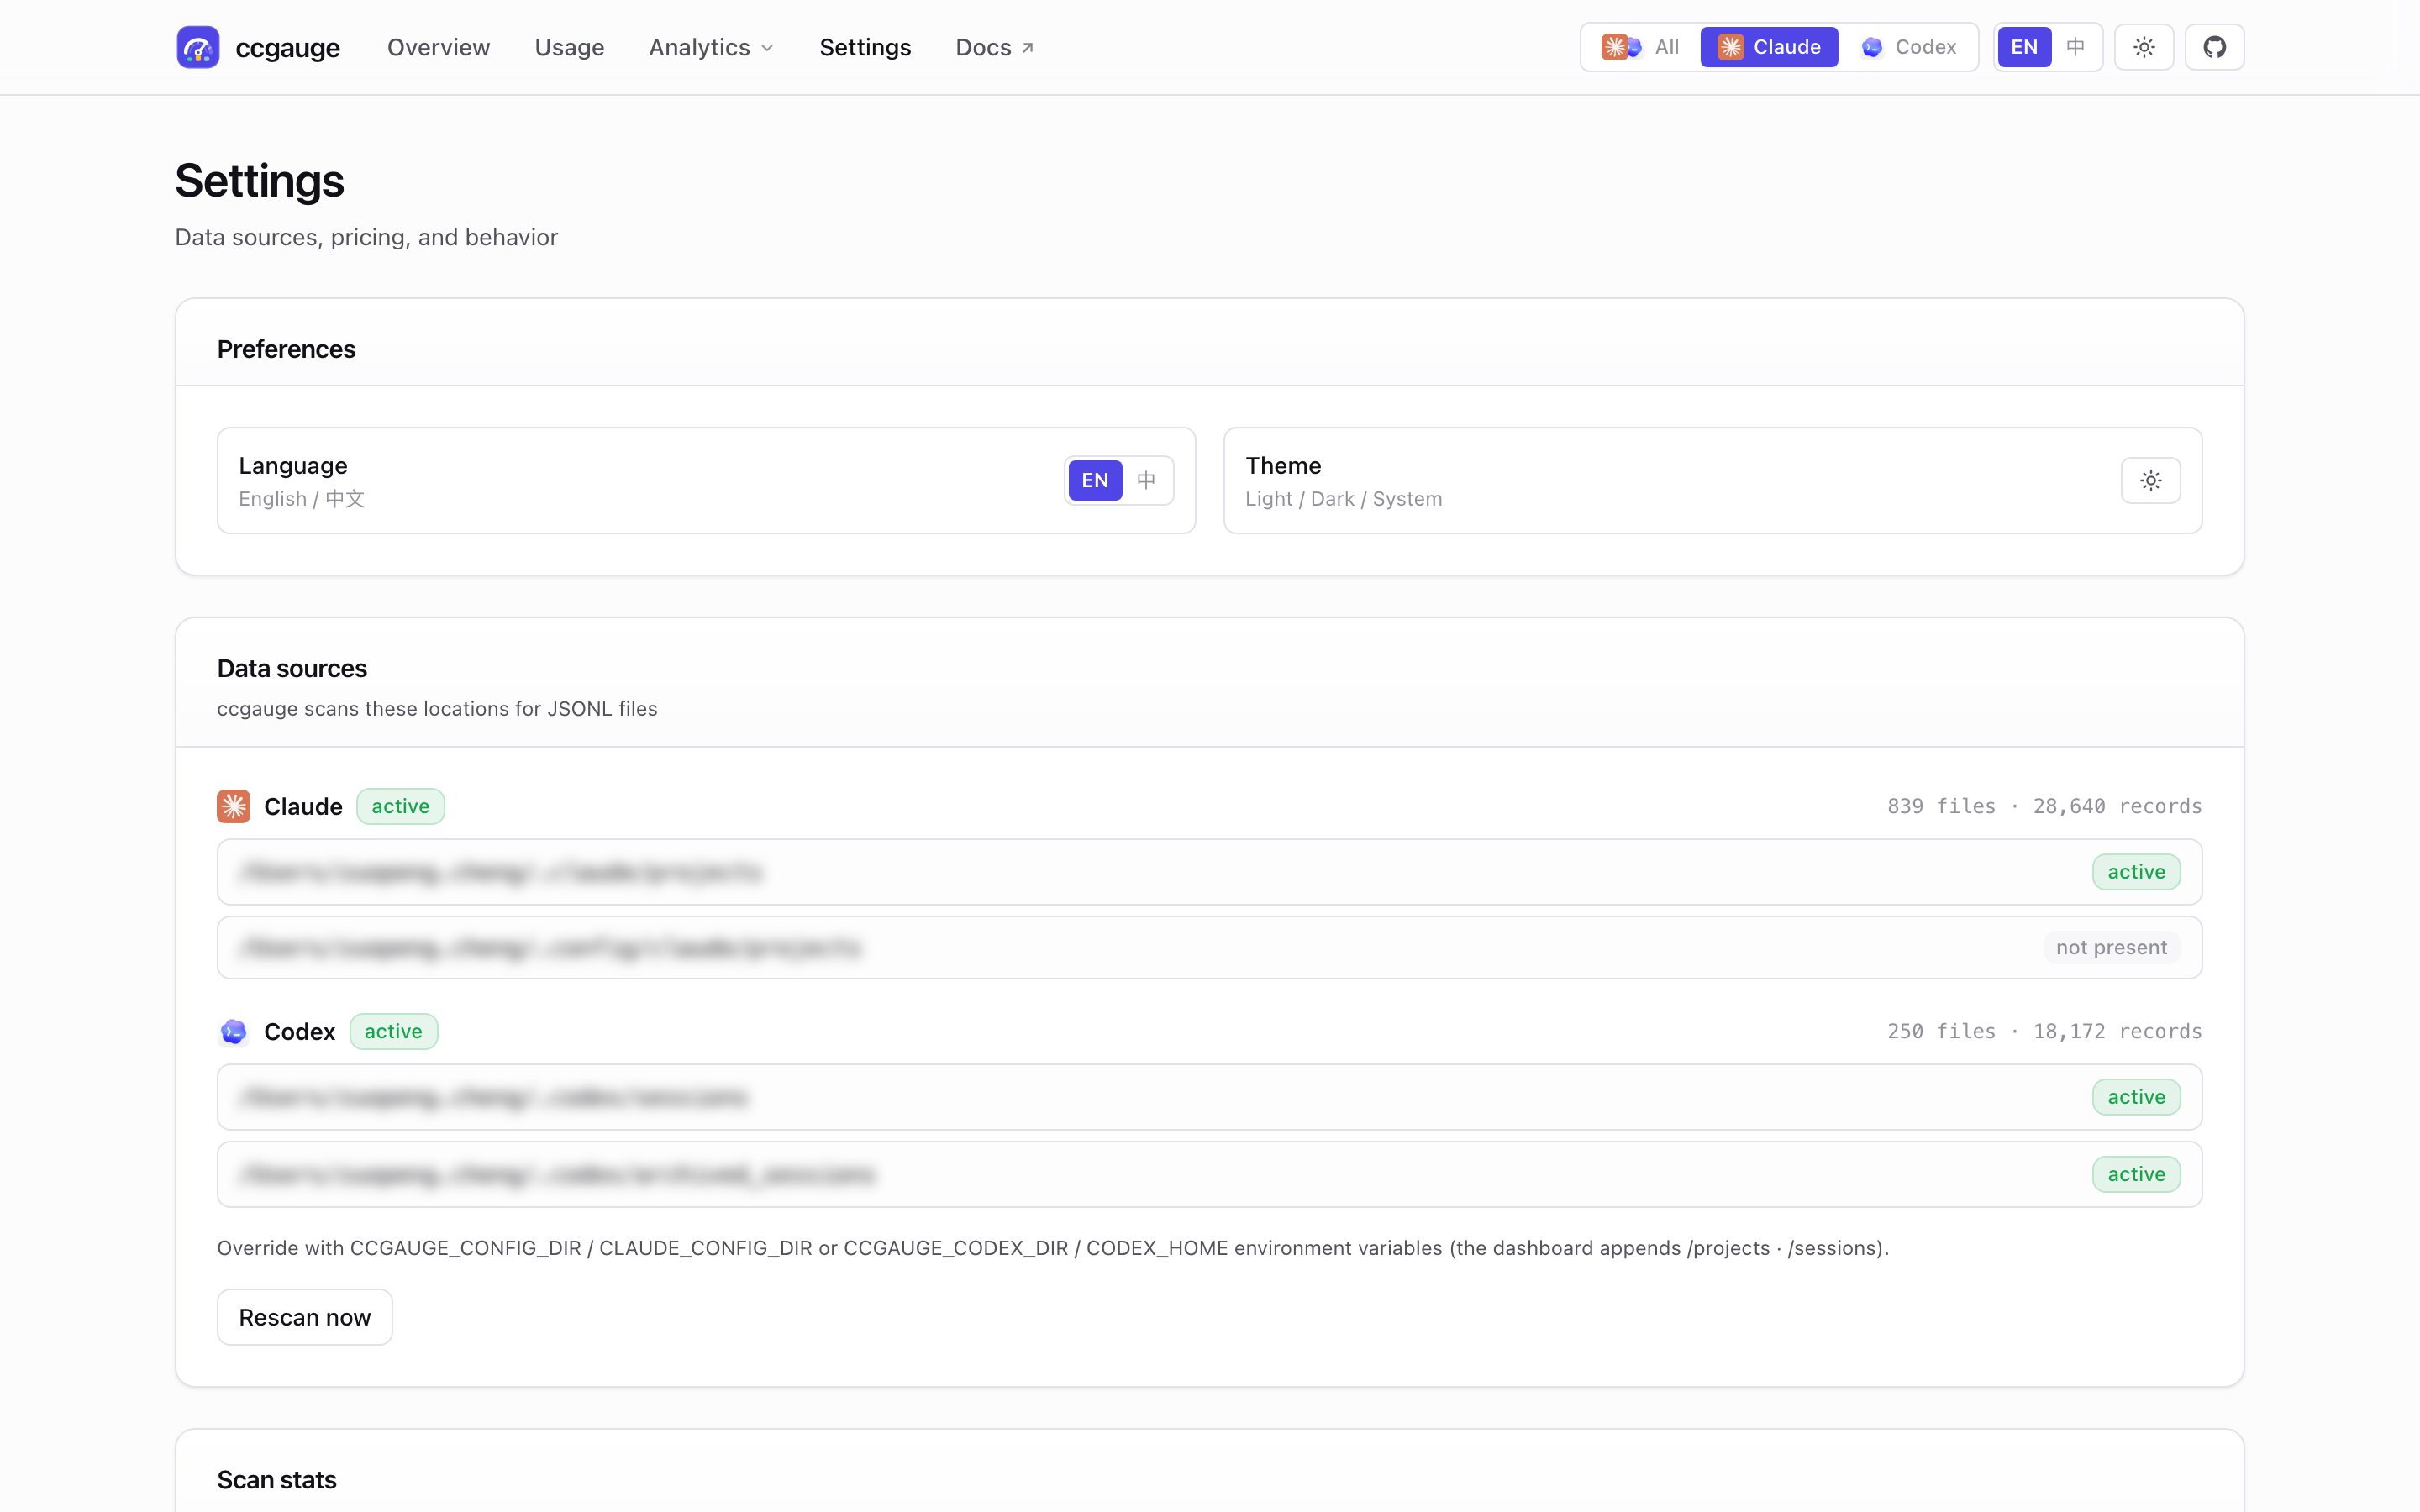
- Settings — detected data sources (with real provider logos), indexer health, scan stats, and a one-click price refresh
- Sessions / Projects / Models / Tools live under an **Analytics** nav dropdown; Overview, Usage and Settings stay top-level
KPI cards + live 5h block tracker
Headline numbers update silently in the background — no spinners, no scroll resets. The 5-hour block card tracks the wall-clock progress of your active conversation window with elapsed %, burn rate per minute, and projected total spend.
- Day-over-day delta on every KPI card
- Live "active 5h block" detection from the JSONL timestamps
- Disclaimer baked in so it's never confused with Anthropic's plan-quota counter
- Auto-refresh every 15s on the usage page, with cursor / search / sort state preserved
Activity heatmap + drill-downs
Day-of-week × hour-of-day grid that shows where your assistant time actually goes. Hover a cell to see message count, total tokens, share-of-total, and share-of-peak. Token-count and message-count are separate heatmaps; share calculations use both.
- Tooltip flips below the cell when the row is near the viewport top
- Compact "active days / streak / peak hour" tiles on the side
- Token-comparison footnote — e.g. "you've used ~12× more tokens than War and Peace"
- Layout adapts to wide and narrow viewports without scrollbar quirks
Usage table + CSV export
Every assistant API call is grouped into its real conversation turn (the parent chain is walked through the JSONL). Expand a turn to see each call's tool list, prompt fragment, and cost. Export to CSV with one click.
- Skills and
- Duration column shows wall-clock elapsed per turn (sortable)
- CSV: UTF-8 BOM (Excel-safe), formula-injection guard,
?level=call|turntoggle - Worktree-aware project labels:
ai-self-web (playwright)instead of justplaywright
CLI report
Run ccgauge report for a one-shot, no-server terminal summary. Aligned tables, colored bar-chart trend, top-N breakdown. Pipe --json into your scripts; pipe colorless output into your CI logs.
-
-r today|1d|7d|30d|90d|allrange presets, or--since/--untilfor arbitrary windows -
-b model|project|sessionbreakdown dimension -
-g hour|day|week|monthtrend granularity -
-m/--projectsubstring filters;--no-trend/--no-breakdownfor slim output
MCP server (for LLMs)
Nine MCP tools let Claude Desktop, Cursor, Cline and other MCP clients query your local usage directly. No screenshots, no copy-paste — you ask, the model answers from structured data.
- Tools: usage_summary, usage_by_time, usage_by_model, usage_by_project, usage_by_session, daily_summary, weekly_summary, recent_activity, cost_estimator
- Reasoning-token breakdown surfaced for models that emit it
- Stdio JSON-RPC — drop into any MCP client config
- Separate named cache (
index-mcp-v2.json) keeps MCP runs from contending with the dashboard
Which skill is eating your context?
The JSONL never records per-tool token usage, so nobody could answer that — until you attribute each tool_result and skill-body payload back to the tool that produced it. The Tools & skills page ranks every tool, skill and MCP server by estimated context footprint.
- Three breakdown dimensions: by skill, by tool, by MCP server
- Expandable per-row stats: invocations, sessions touched, average per call, largest single payload
- Skill bodies are measured from the "Base directory for this skill" injection, not the tiny launch ack — that is where the context actually goes
- Estimated at ~4 chars/token from payload size. The page says so: trust the ranking, not the absolute numbers
- Claude source only — Codex rollouts don't carry the shape this needs
Prices that stay current
A model released after your ccgauge version used to cost out wrong. Now the price table refreshes itself from LiteLLM at runtime, on top of the snapshot committed in the package.
- Fetched in the background on first page load, validated, and cached to
~/.ccgauge/cache/litellm-pricing.jsonfor 24 h - Single-flighted and timeout-bounded — it never blocks a request, and a bad upstream table is rejected in favour of the built-in snapshot
- "Refresh prices" button on Settings, with a line showing whether prices came from the snapshot or a cached LiteLLM copy and when
-
CCGAUGE_OFFLINE=1disables fetching entirely;CCGAUGE_PRICING_TTL_MStunes the cache lifetime
Privacy & polished local UI
100% local. Reads the JSONL session files your CLI already writes. Nothing about your usage is ever transmitted; the dashboard's one outbound request downloads public model prices, and CCGAUGE_OFFLINE=1 turns it off. Bound to 127.0.0.1 by default. MIT licensed.
- Light / dark / system theme with no flash on first paint
- English + 简体中文 throughout the dashboard, CLI, and MCP responses
- No analytics, no telemetry, no API keys required
- Source on GitHub — see exactly what gets read and what doesn't
Background service + multi-profile
Treat ccgauge as a daemon when you want it. Full lifecycle: start --background, stop, restart, status, open, logs. State persists under ~/.ccgauge/ so reboots don't lose your config.
-
restartinherits the previous run'sport / host / dir / log - Cross-platform: macOS, Linux, Windows (windowsHide on detached spawn)
-
CCGAUGE_STATE_DIRenv override for isolated test / workspace profiles -
ccgauge status --jsonfor monitoring scripts
How ccgauge counts tokens and cost.
Source of truth: your CLI's JSONL
ccgauge never re-runs an API call. It reads the JSONL session files that Claude Code (~/.claude/projects/) and Codex CLI (~/.codex/sessions/) already write to disk, and dedupes (messageId, requestId) across sub-agent forks and worktree mirrors.
Pricing: snapshot, not lookup
Per-million-token rates ship inside ccgauge. Unknown variants fall back to family-latest (e.g. gpt-5.5-foo → gpt-5.5). When Anthropic or OpenAI publish new prices, you bump ccgauge and get fresh numbers — no API calls, no rate-limit dependence.
Codex cost model
Codex CLI emits cumulative usage per token_count event. ccgauge computes forward-only deltas and skips duplicate refresh events. The displayed cost is the "what the OpenAI API would have charged" equivalent for users on subscription / managed plans.
Cache savings
We compute what every cache-read would have cost at full input rate, then show the delta as "Saved by cache". Cache-creation tokens are billed at their actual rate; the savings headline is upper-bounded by what a cold prompt would have cost.
Ready to try it?
One command — opens a dashboard at localhost:3737.
npx ccgauge
See the CLI reference →